In the quiet neighborhoods of California, even a small increase in air pollution—specifically tiny particles called PM2.5—can lead to public alerts, news reports, and quick action from the government. But thousands of miles away in New Delhi, India, people deal with thick, grey smog almost every day. And it’s so common that many just accept it, take off their masks, and continue with life as usual. Thus to understand the AQI difference, here check the air pollution in the US and India as a tale of two countries.
This contrast shows a bigger issue: while air pollution is a global problem, not all countries respond to it in the same way. Because this is just not about New Delhi, India, as most of the North Indian cities are experiencing high AQI levels.
Even though we know more than ever about the dangers of polluted air, and have better technology to fight it. However, air pollution is still one of the biggest threats to our health worldwide. As the World Health Organization (WHO) says, PM2.5—tiny particles less than 2.5 microns wide—can go deep into your lungs and bloodstream, hence increasing the risk of heart attacks, strokes, and early death.
So why do some countries take strong action, while others don’t? Thus, this blog takes a closer look at that question by comparing air pollution in the United States and India from 2020 to 2025.
Understanding AQI and PM2.5: Why They Matter
The Air Quality Index (AQI) is a scale that measures air pollution, ranging from 0 (clean air) to 500 (very dangerous air). It tracks different pollutants like PM2.5, PM10, ozone, carbon monoxide, sulfur dioxide, and nitrogen dioxide. PM2.5 is the most dangerous because it is very small and can go deep into the lungs and bloodstream, causing serious health problems. The World Health Organization (WHO) recommends that the annual average of PM2.5 should not be more than 5 micrograms per cubic meter (µg/m³) and the daily average should not be above 15 µg/m³. Sadly, many cities, especially in South Asia, often have levels much higher than these safe limits.
Background: A Tale of Two Responses
India: Dealing with Ongoing Pollution
Air pollution in India is a big problem. Because of rapid urbanization, Fast-growing cities, crop burning, use of dirty fuels, and pollution from factories and construction all make it worse. As a result, cities like New Delhi, Patna, Mumbai, etc often have air pollution levels far above safe limits.
Thus, India has started to act by launching programs to clean the air and setting pollution rules. But these actions are not always followed well. People know about the pollution, but many feel there’s nothing they can do and just accept it as part of life.
United States: Years of Fighting Pollution
On the other hand, the United States’ air quality has improved a lot over the past 40 years. Laws like the Clean Air Act and help from the Environmental Protection Agency (EPA) have lowered pollution. Though places like California still struggle with pollution from things like wildfires and cars, any rise in pollution levels quickly grabs attention and leads to action.
The most areas with high pollution levels in the US selected with this Article:
U.S. Cities: Vigilance Over Minor Spikes
| City | AQI | PM2.5 (µg/m³) | WHO 24-h Limit (µg/m³) | Exceeds WHO 24-h by… |
| Bakersfield–Delano, CA | 26 | 4 | 15 | No |
| Visalia, CA | 36 | 7 | 15 | No |
| Fresno–Hanford–Corcoran, CA | 38 | 6 | 15 | No |
| Eugene–Springfield, OR | 22 | 4 | 15 | No |
| Los Angeles–Long Beach, CA | 36 | 7 | 15 | No |
| Detroit–Warren–Ann Arbor, MI | 59 | 13 | 15 | No |
| San Jose–San Francisco–Oakland, CA | 50 | 9 | 15 | No |
| Houston–Pasadena, TX | 59 | 14 | 15 | No |
| Cleveland–Akron–Canton, OH | 54 | 11 | 15 | No |
| Fairbanks–College, AK | 18 | 3 | 15 | No |
Data from: AQI.in
Indian Cities: Chronic Exceedances
| City | AQI | PM2.5 (µg/m³) | WHO 24-h Limit (µg/m³) | Exceeds WHO 24-h by… |
| New Delhi, DL | 177 | 74 | 15 | Nearly 5× |
| Ghaziabad, UP | 148 | 58 | 15 | Nearly 4× |
| Chandigarh | 140 | 51 | 15 | 3.4× |
| Howrah, WB | 95 | 33 | 15 | 2.2× |
| Asansol, WB | 155 | 62 | 15 | 3.1× |
| Lucknow, UP | 162 | 71 | 15 | 3.7× |
| Patna, BR | 189 | 108 | 15 | 6.2× |
| Mumbai, MH | 89 | 29 | 15 | 1.9× |
| Pune, MH | 110 | 39 | 15 | 2.6× |
| Agartala, TR | 68 | 18 | 15 | Yes |
Data from AQI.in
The above tables highlight the real-time air quality levels in these areas. According to this, the PM2.5 levels show how most polluted areas in India exceed the WHO’s 24-hour PM2.5 limit and still, the concern is under the rug. However, Table 1 shows that the US areas are not exceeding the PM2.5 levels, not even in a single area. Still, this concludes that nearly half of Americans are breathing polluted air.
Note: All the real-time data collected on 24th April, 2024 at 12:00 PM.
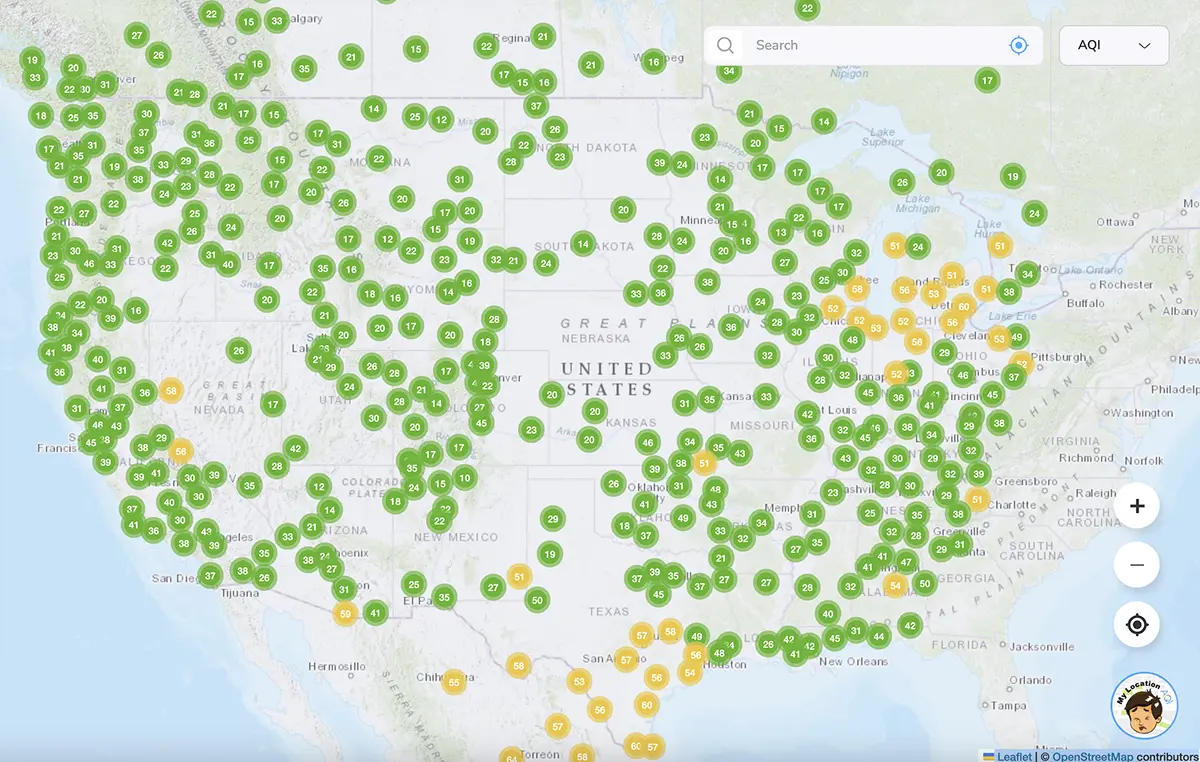
Air Quality in the U.S.: Watching Even Small Changes
Air pollution in the U.S. has gotten much better over the years. But some cities still deal with problems from time to time. Because even small increases in pollution are taken seriously and closely tracked.
Here’s a look at how air quality has changed in some U.S. cities:
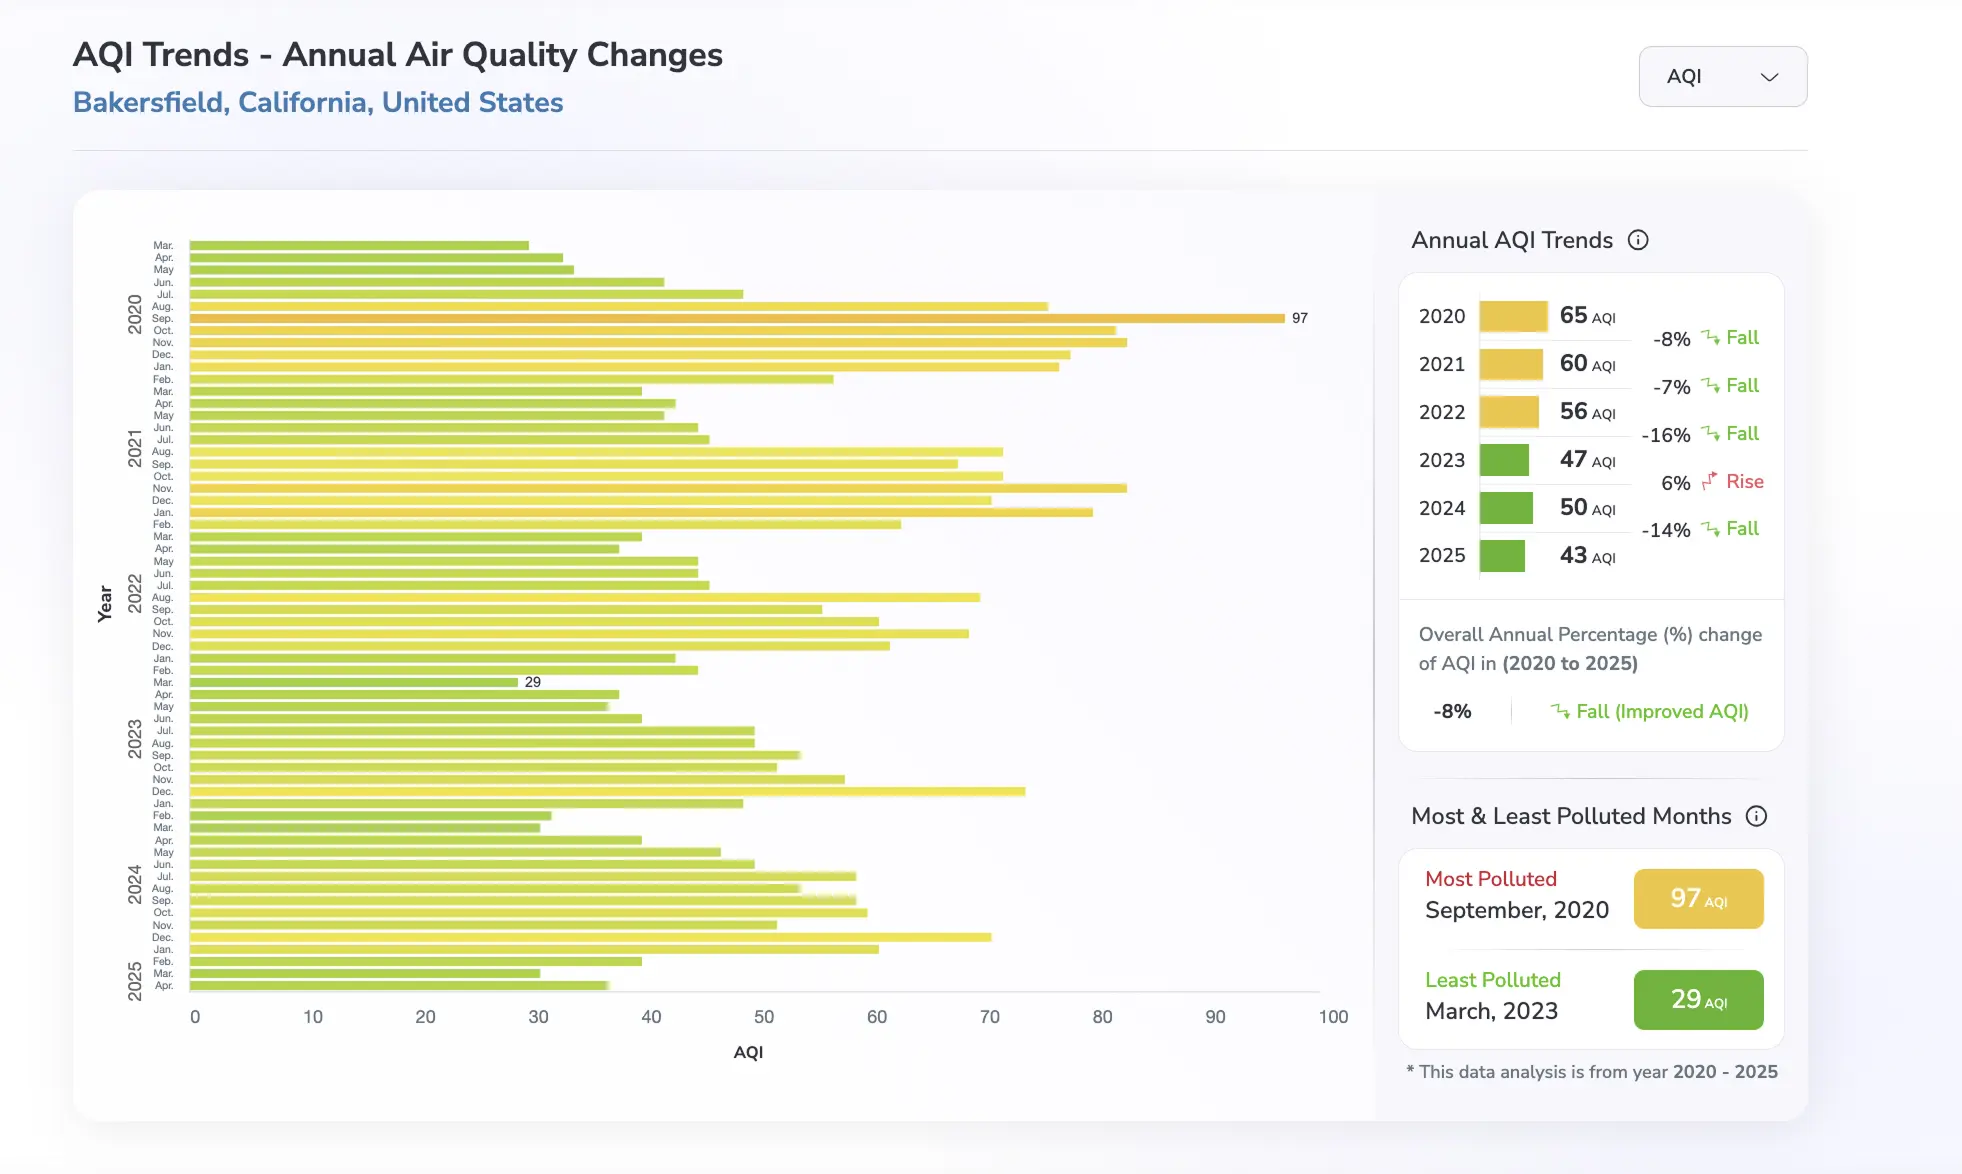
- Bakersfield, California: The average AQI in 2024 was 50. Then in December, it climbed to 71. This is still considered moderate, but it’s a change worth paying attention to.
- Houston, Texas: Air quality was generally good in early 2025, with an AQI of 46 in March and 45 in April. However, a small rise to 49 in March made it the most polluted month so far.
- Visalia, California: There’s been a big improvement here. The AQI dropped from 72 in 2020 to an expected 36 in 2025. Still, back in September 2020, a sudden jump to 118 caused concern.
- Los Angeles, California: Overall, the air is getting cleaner. AQI fell from 56 in 2020 to 44 in 2025. Even so, a small 2% increase from 2024 to 2025 raised some worries.
- Detroit, Michigan: In 2025, AQI went from 29 in April to 43 in March. That 43% jump in just one month caught attention.
- Fairbanks, Alaska: The AQI rose over time, from 29 in 2020 to 64 in 2025. The highest level was 98 in February 2025—the worst in five years.
- Eugene, Oregon: In 2025, the average AQI was 29. But looking back, a major spike to 140 in September 2020 still stands out.
- Cleveland, Ohio: The average AQI in 2025 was 34, just a small 2% rise since 2020. However, a peak of 64 in June 2023 was the highest recorded.
- San Jose, California: AQI increased from 31 in 2023 to 42 in 2025—a 24% rise. The worst reading was 73, seen in September 2020.
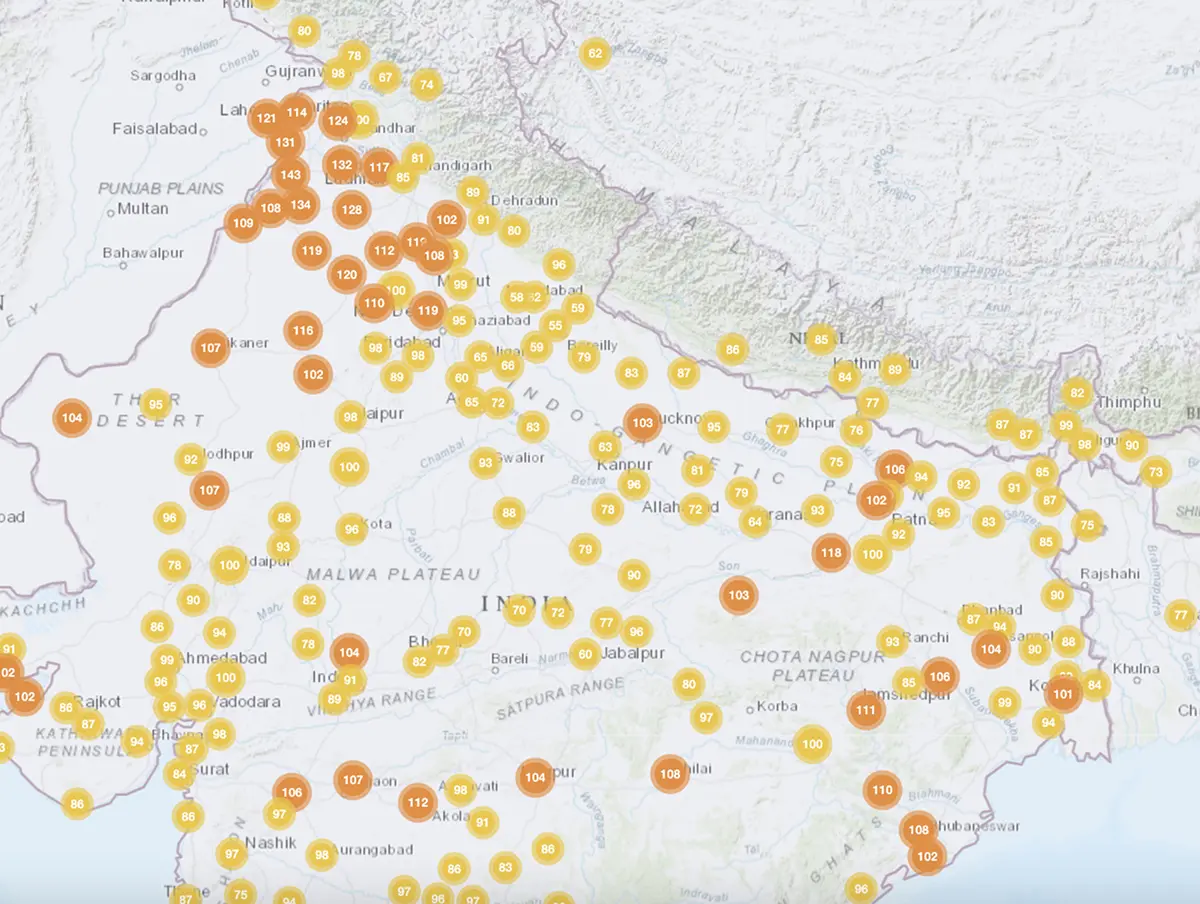
Air Quality in India: Pollution Stays High
Many cities in India are still facing serious air pollution problems. For example, places like Howrah, Ghaziabad, Patna, New Delhi, Asansol, and Agartala often have AQI levels over 150. Besides, sometimes even reaching dangerous levels. Unlike the U.S., where air quality is improving, these cities haven’t seen much progress. Here’s a closer look at what the numbers say:
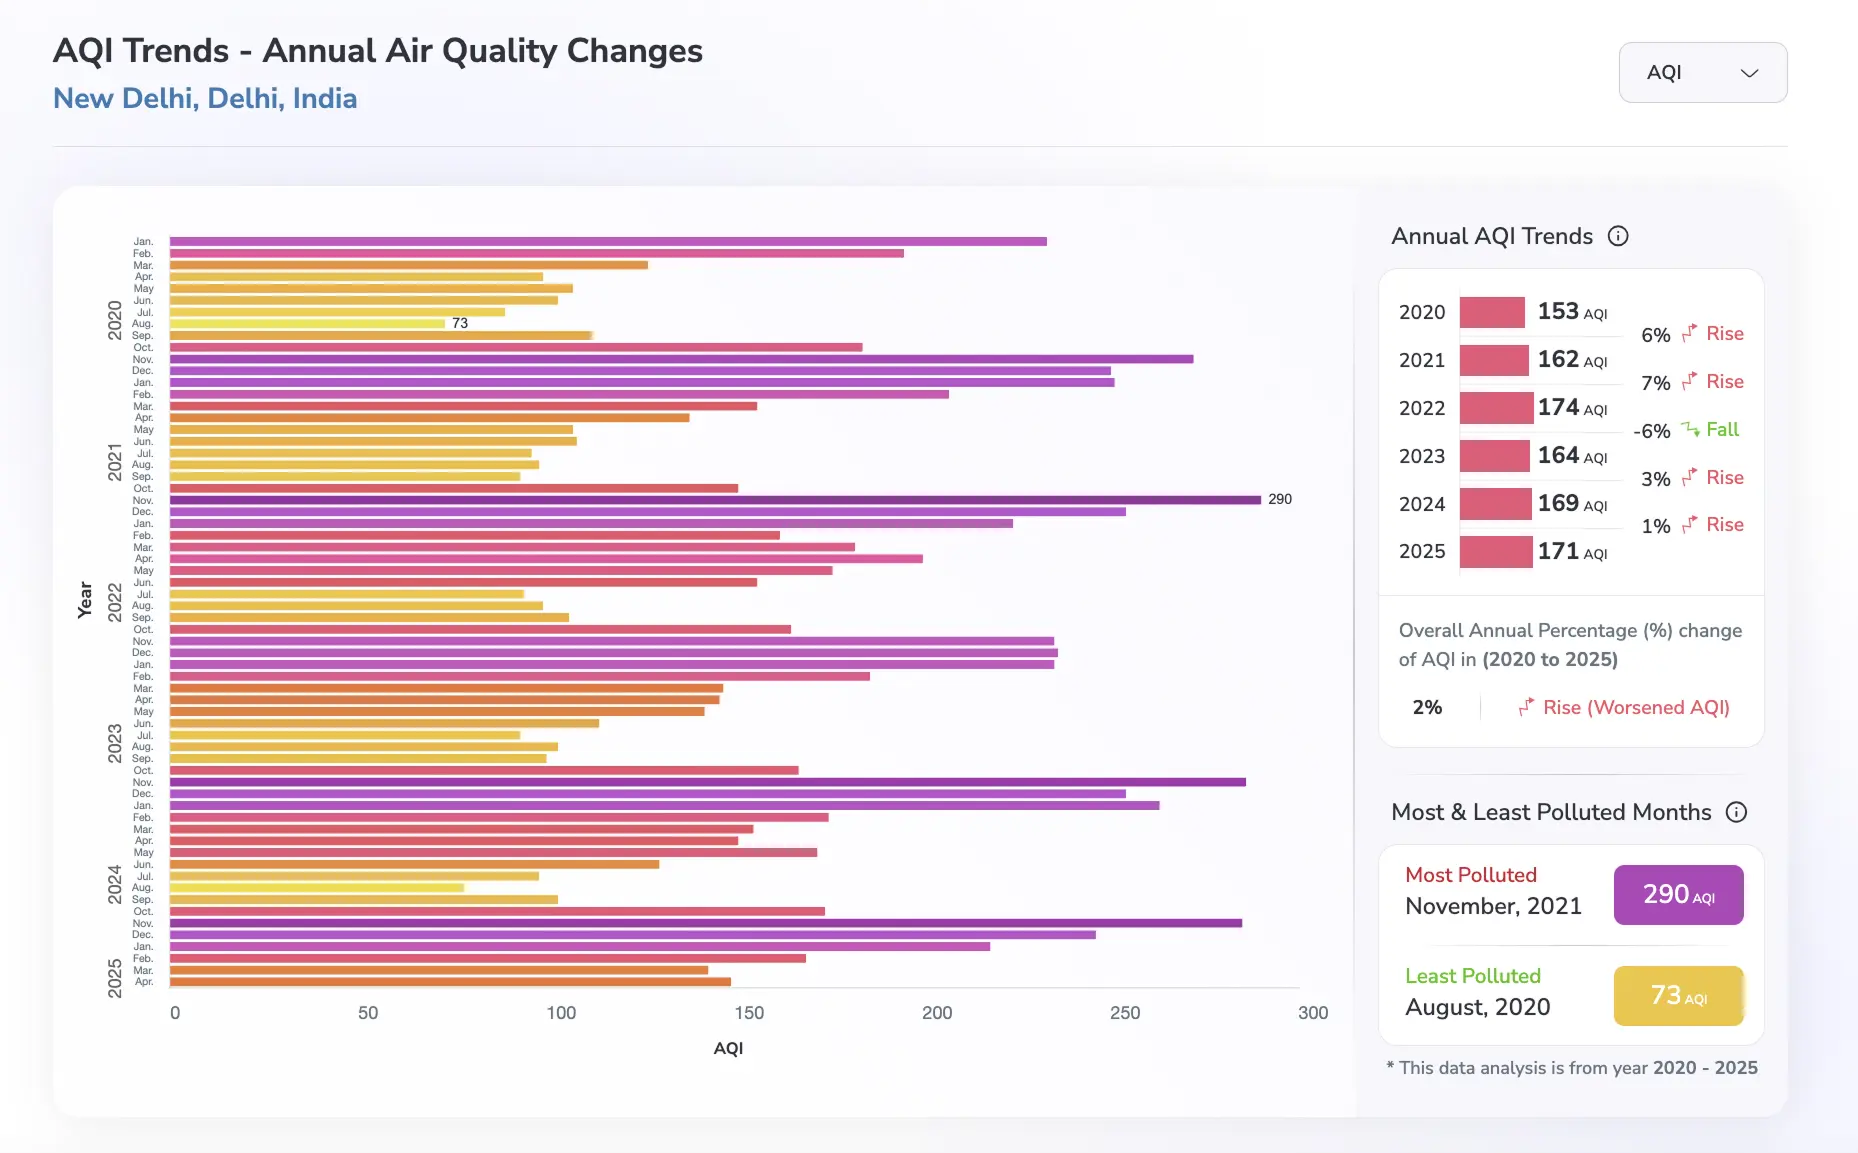
- New Delhi, Delhi: The worst level was 290 in November 2021. As of 2025, the average AQI is 171—slightly up from 153 in 2020.
- Howrah, West Bengal: The AQI was 52 in July 2023 but had already hit a high of 241 back in December 2020. In 2025, the average AQI is 140—about 8% higher than in 2020.
- Ghaziabad, Uttar Pradesh: This city recorded a very high AQI of 333 in November 2020. Since then, the yearly average hasn’t changed much, showing no real improvement through 2025.
- Patna, Bihar: AQI dropped to 61 in July 2020 but later spiked to 289 in November 2023. The average for 2025 is 157, which is 6% higher than in 2020.
- Asansol, West Bengal: The AQI ranged from 63 in July 2023 to a high of 182 in December 2020. The 2025 average is 147, marking a 7% rise since 2020.
- Agartala, Tripura: Air quality reached a peak of 217 in January 2024. In 2025, the average stands at 119—9% higher than the 85 recorded in 2020.
U.S. vs. India: A Stark Comparison
The following table compares 2025 annual AQI averages for selected cities:
| U.S. City | AQI (2025) | Indian City | AQI (2025) |
| Houston | 46 | Howrah | 140 |
| Bakersfield | 43 | Ghaziabad | 163 |
| Visalia | 36 | Patna | 157 |
| Los Angeles | 44 | New Delhi | 171 |
| Detroit | 32 | Asansol | 147 |
| Fairbanks | 64 | Agartala | 119 |
In the US, even the highest AQI (Fairbanks, 64) is “moderate,” and small rises (e.g., 2% in Cleveland) are tracked diligently. Moreover, in India, AQI levels are “unhealthy” or worse, with Agartala’s 119 being the lowest, still nearly double Fairbanks’ value.
What This Means
In the U.S., even small changes in air quality—like a 24% rise in San Jose or a sudden spike in Eugene, get attention and lead to quick action. Hence, this shows how seriously the U.S. monitors pollution and follows up with strong policies.
In contrast, cities in India often live with much worse air, with AQI levels regularly over 150 and even reaching 333 in places like Ghaziabad. But these high numbers are treated as normal, and little is done to fix the problem.
And, this difference shows how each country treats air pollution. The U.S. works hard to keep the air clean, while India still struggles with poor enforcement and a lack of urgent action—even though the are severe.
Moreover, the numbers show that India needs more awareness and stronger efforts to fight pollution. At the same time, the U.S. shows how staying alert to small changes can help keep air quality under control. Since, the climate continues to change, both countries offer lessons for the rest of the world.
Take Action: Share this post to raise awareness about air pollution—especially in the most affected parts of India—and help push for real change.