New Delhi Air Quality Index (AQI) | Air Pollution
Real-time PM2.5, PM10 air pollution level in Delhi
Last Updated: 2025-05-30 02:55:42 AM (Local Time)


29 °C
MistNew Delhi
Major Air Pollutants
New Delhi
Trending in India
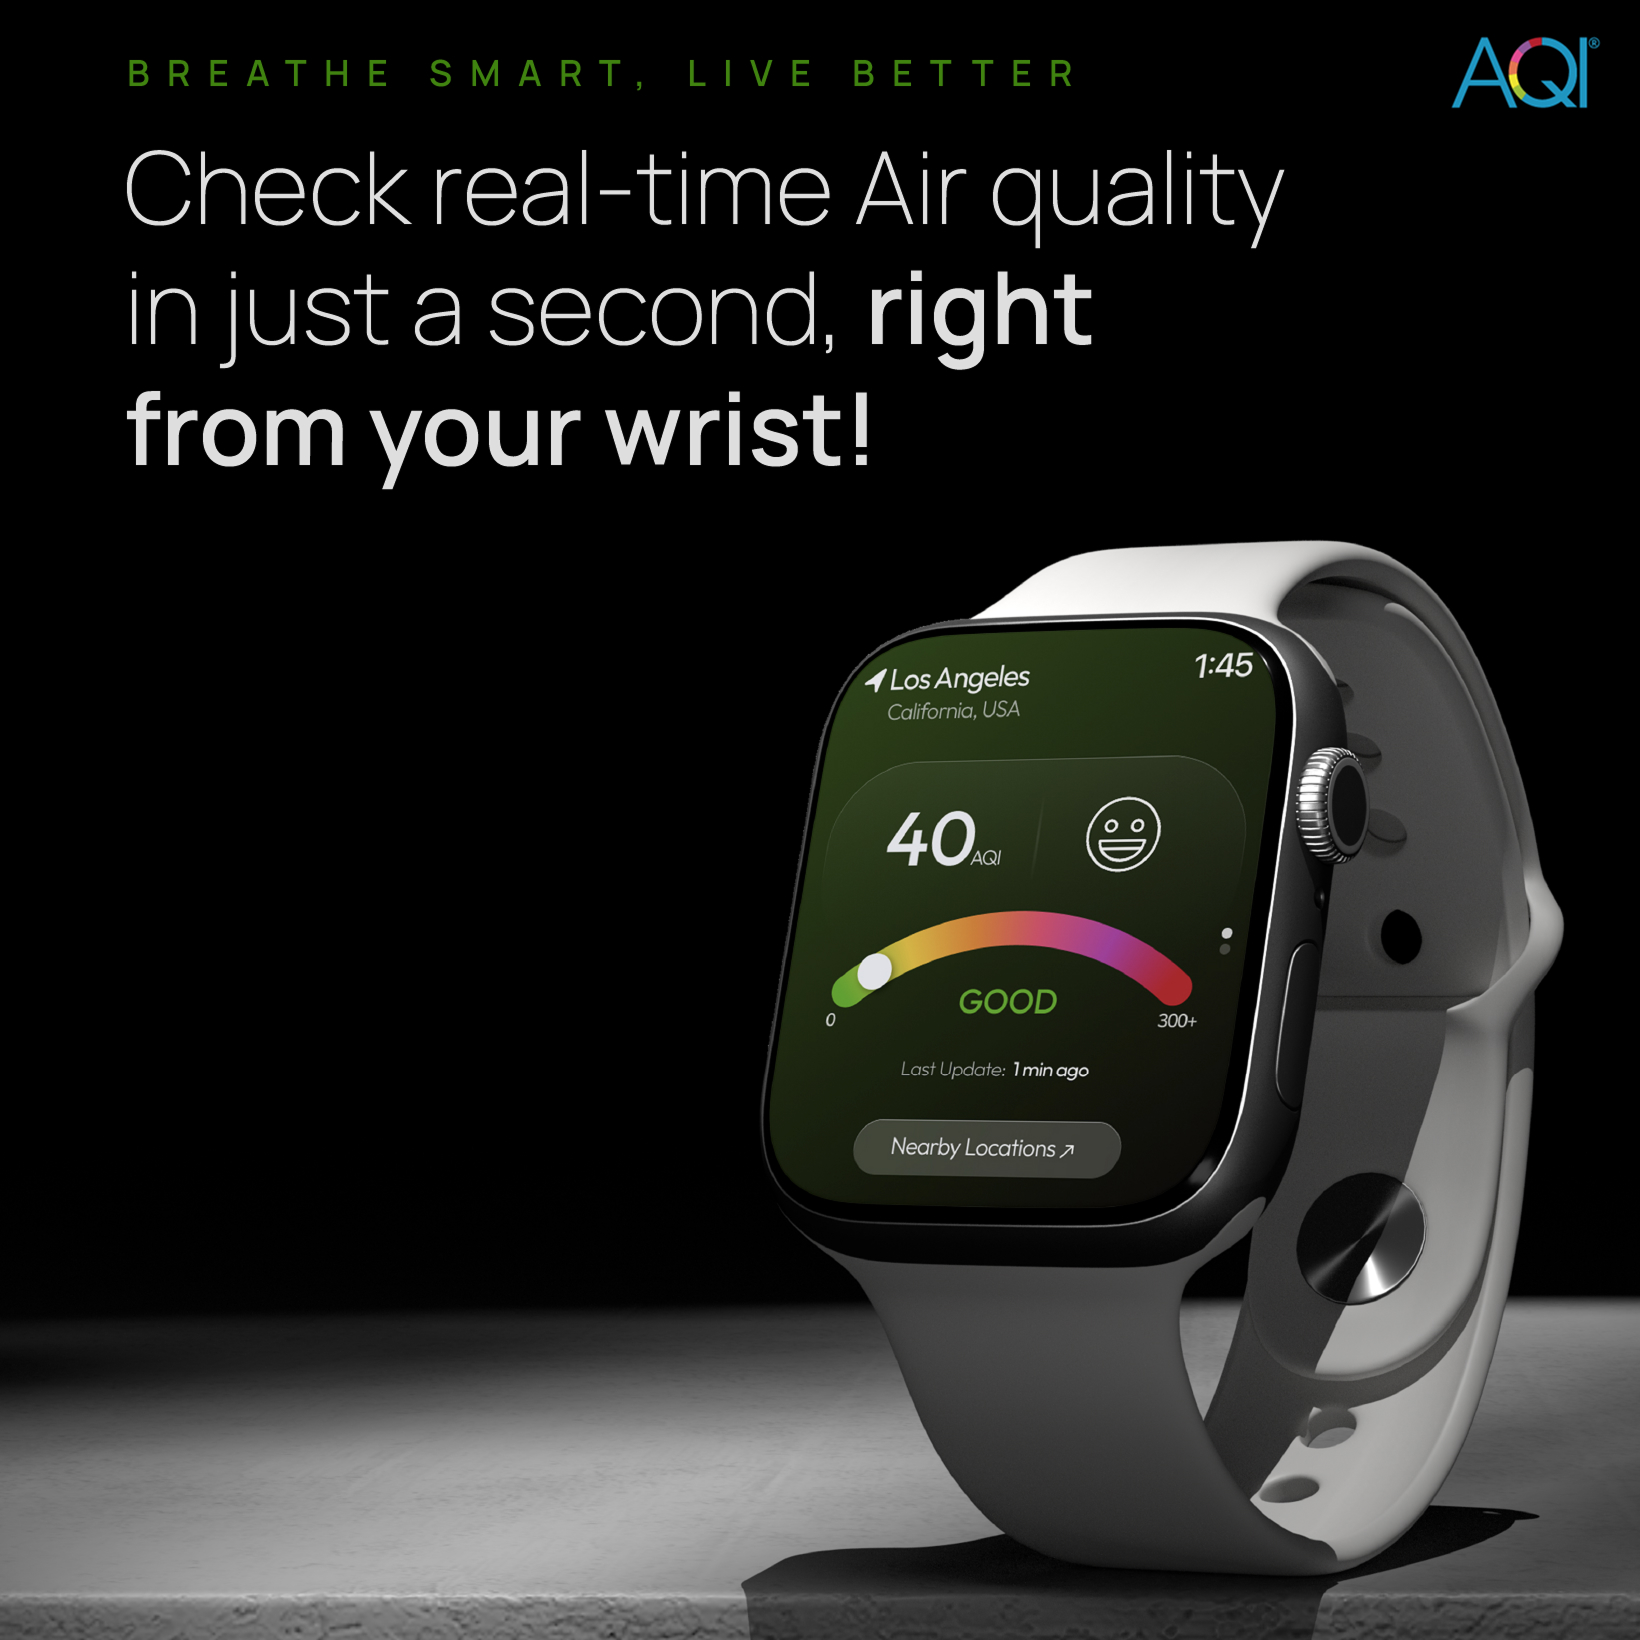
Big News: AQI App is Now on Apple Watch!
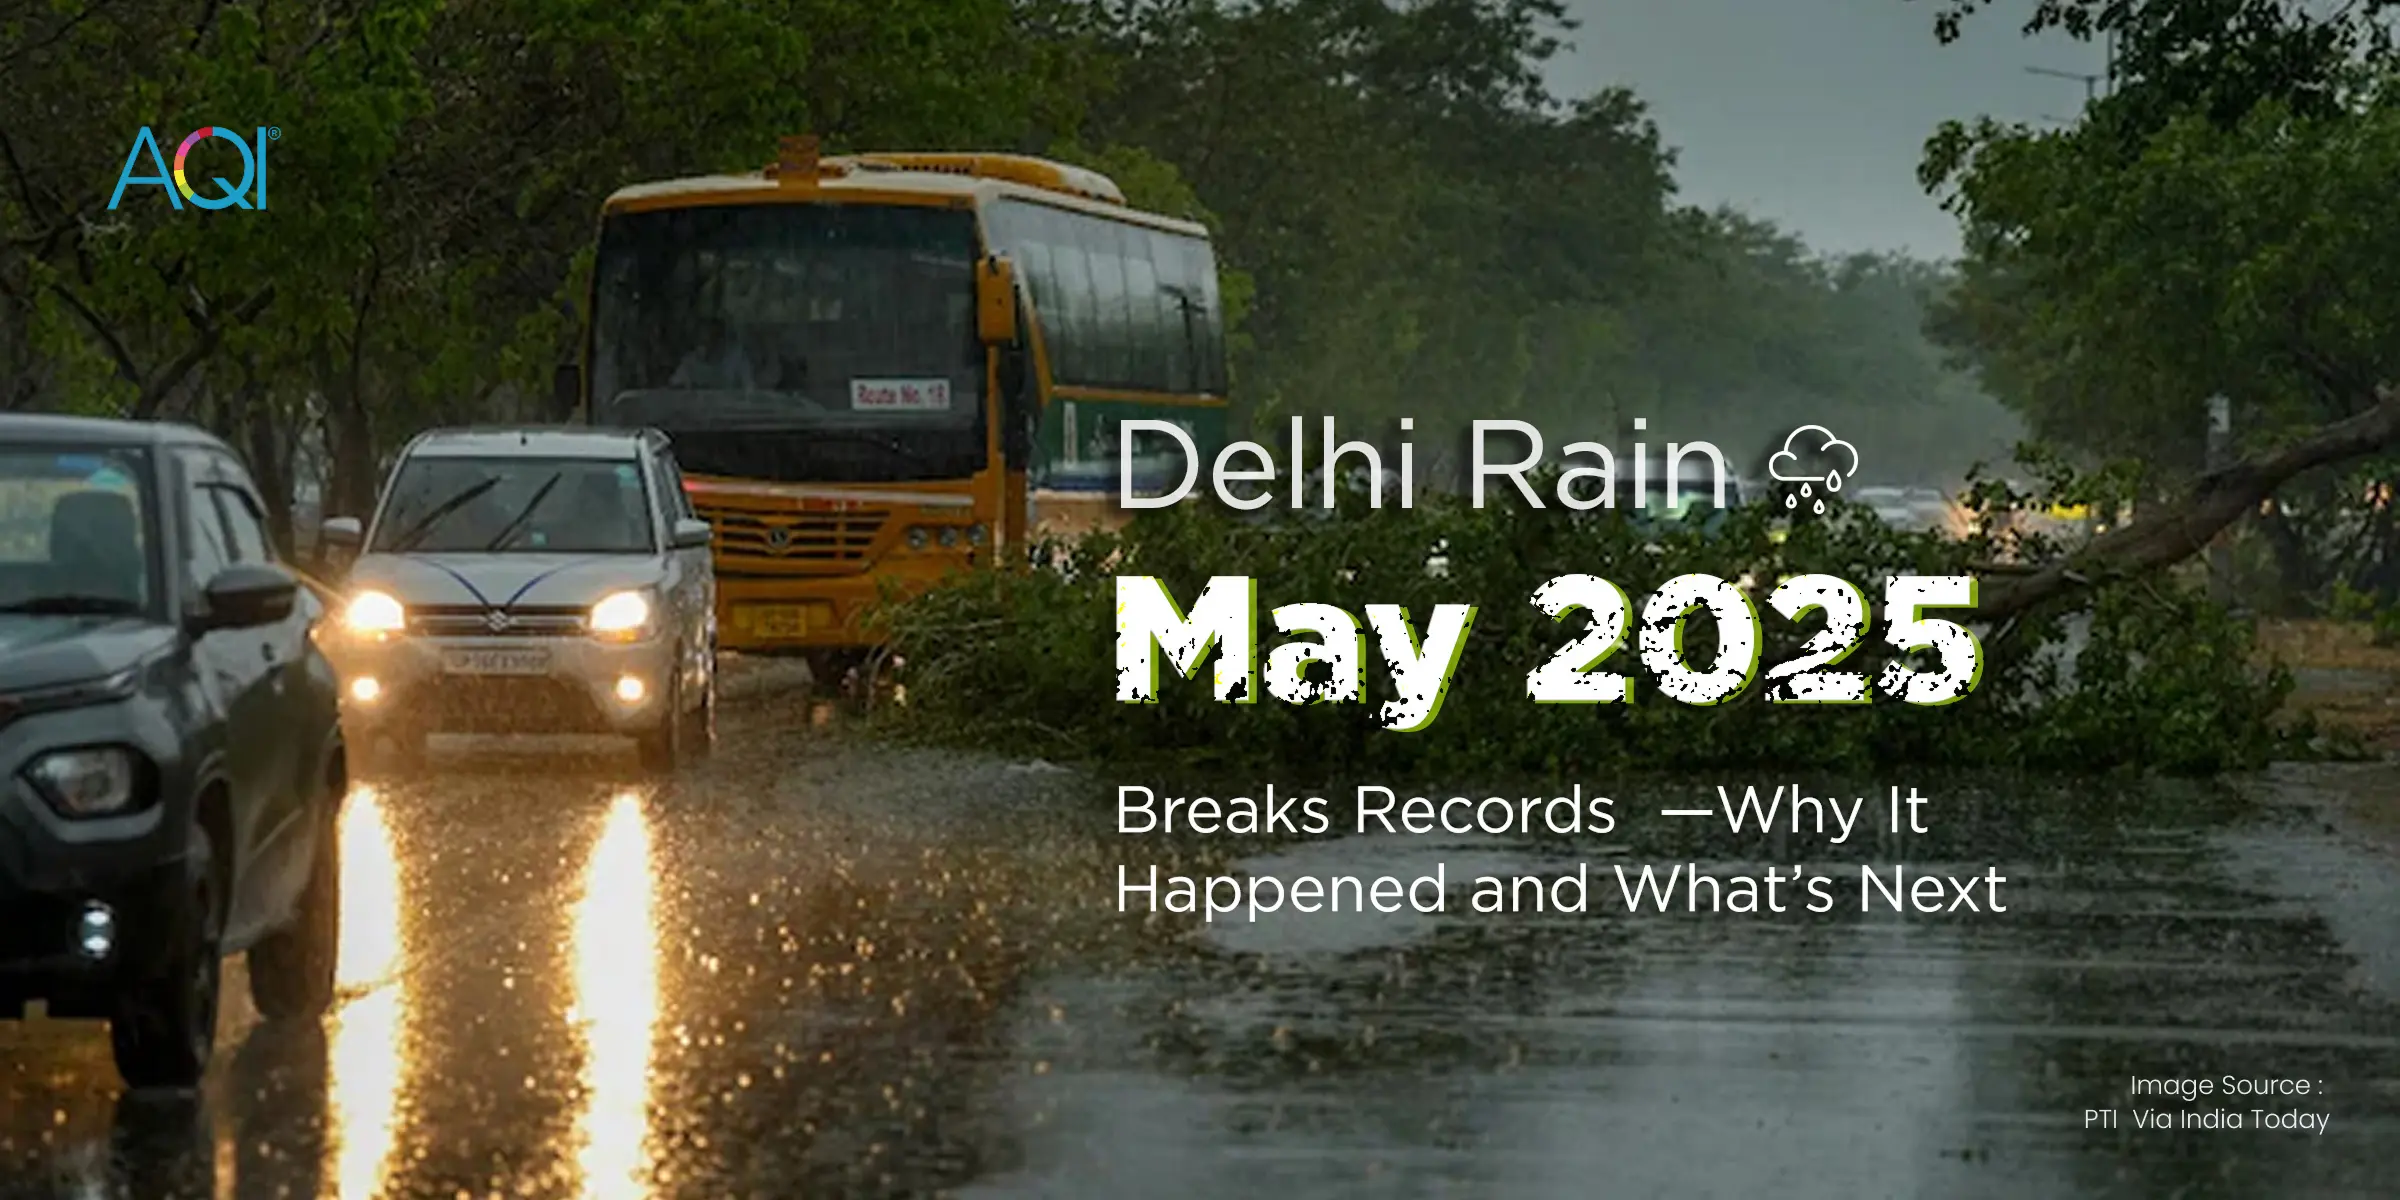
Delhi Rain May 2025 Breaks Records — Why It Happened and What’s Next
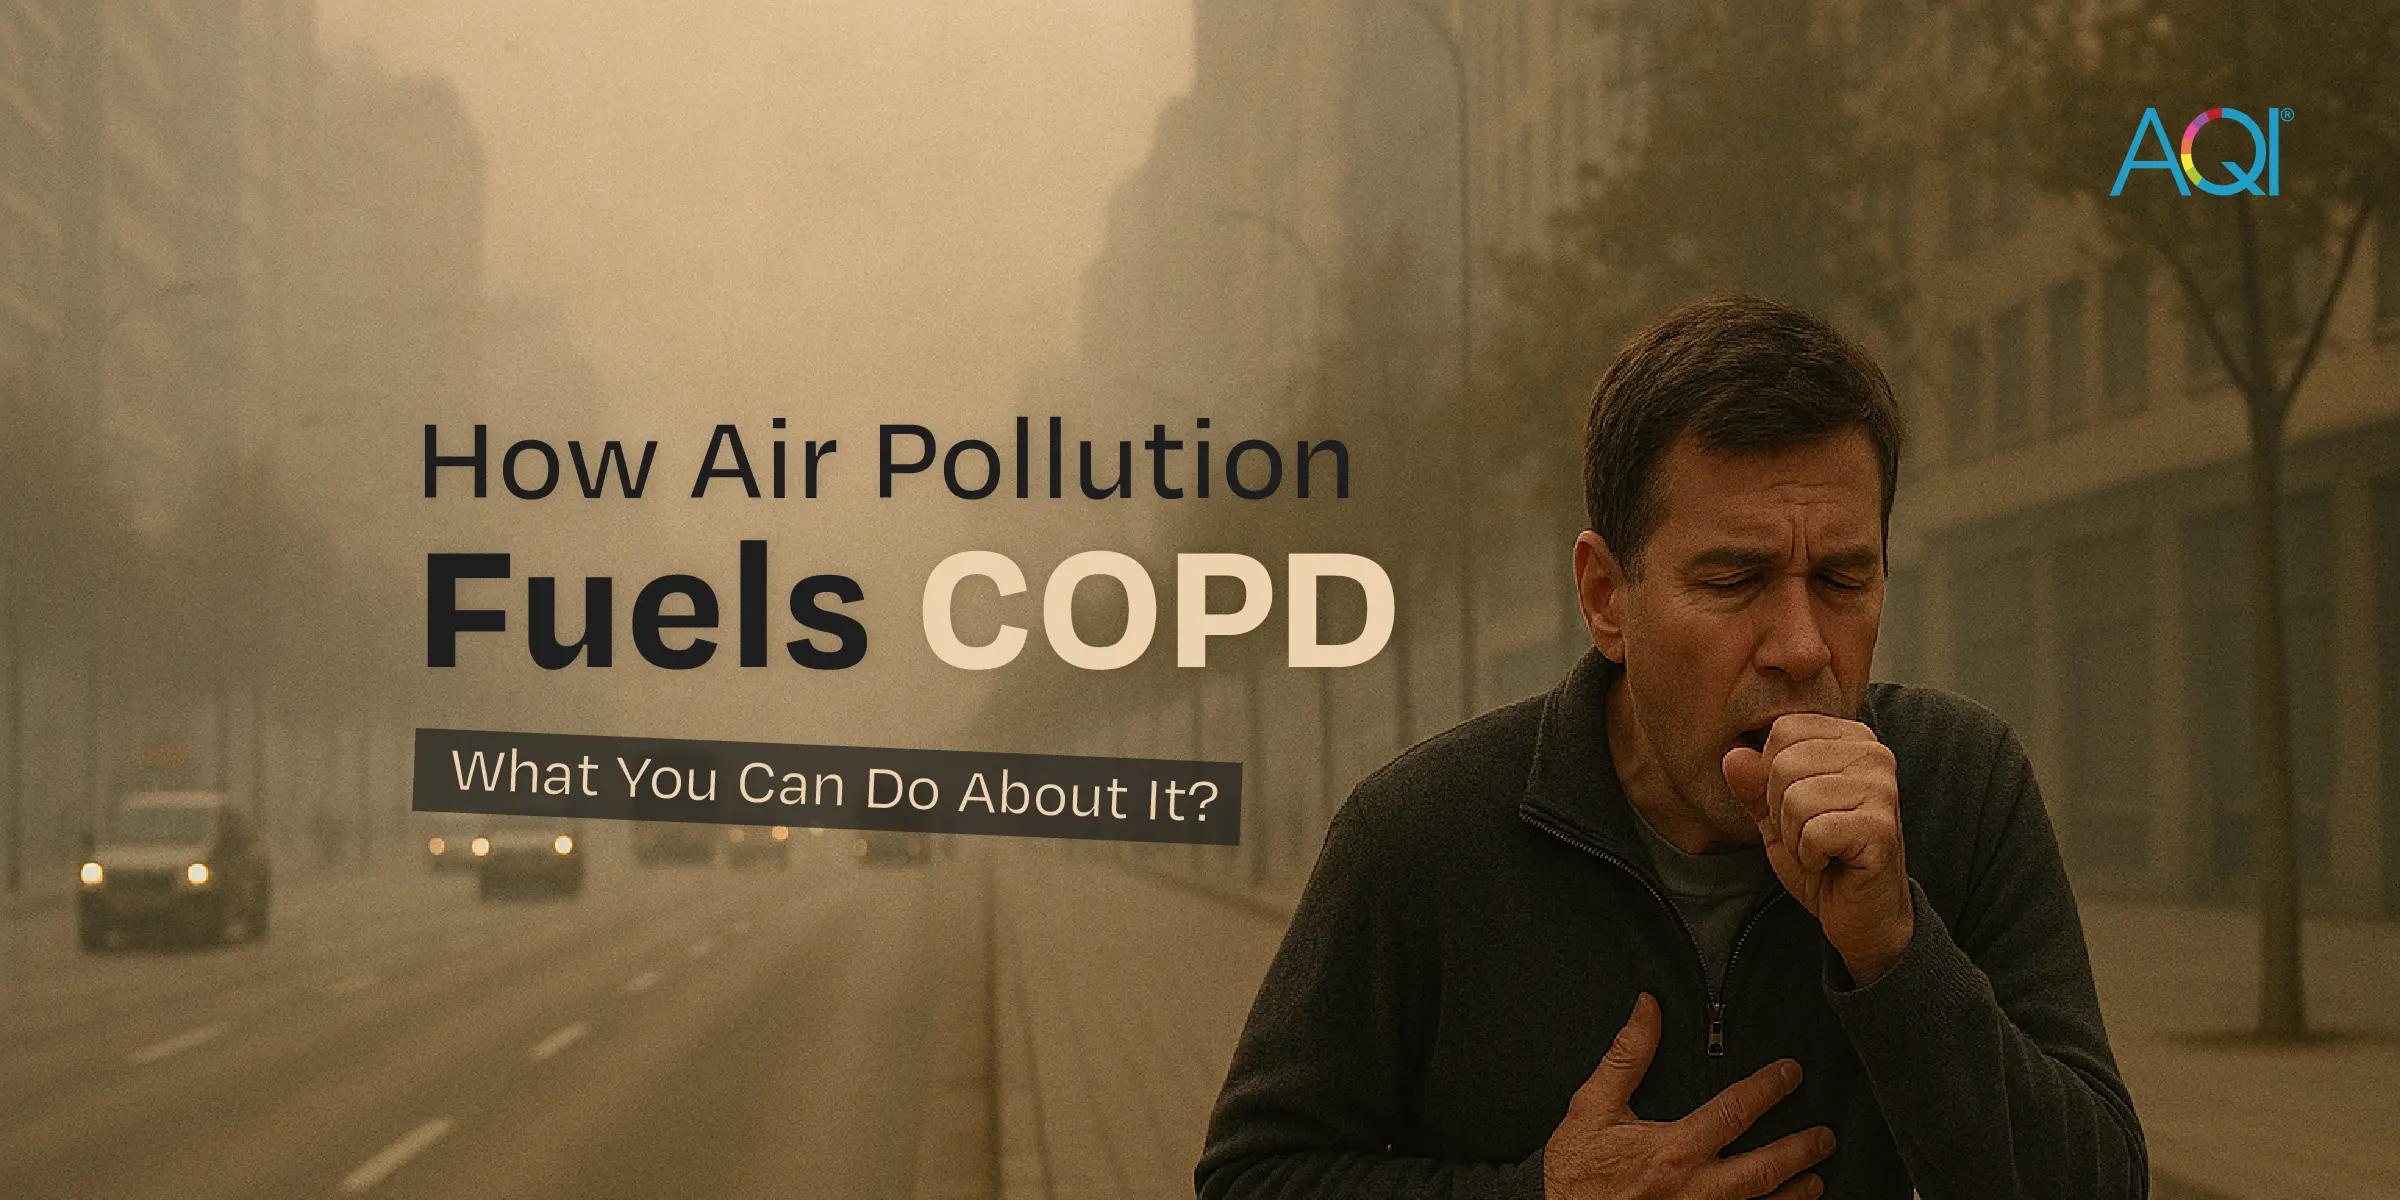
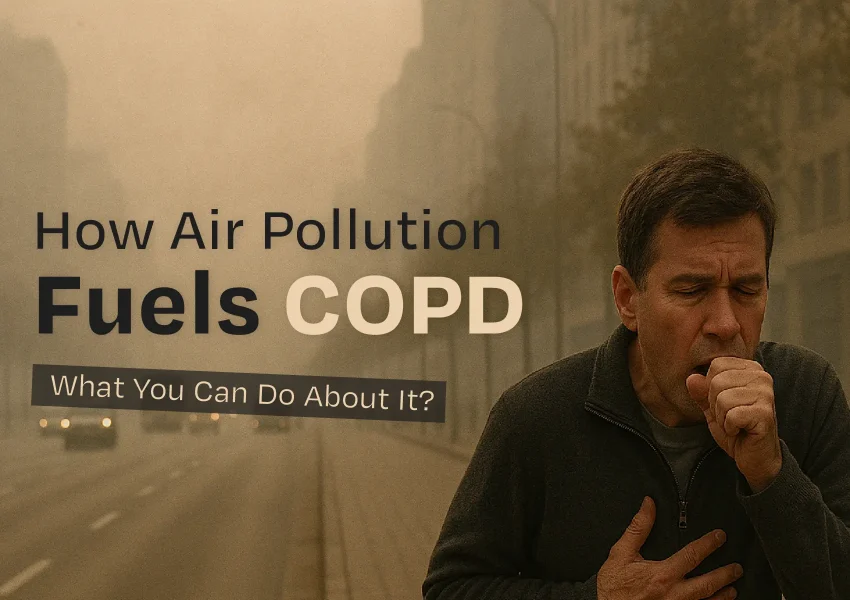
How Air Pollution Fuels COPD—and What You Can Do About It?
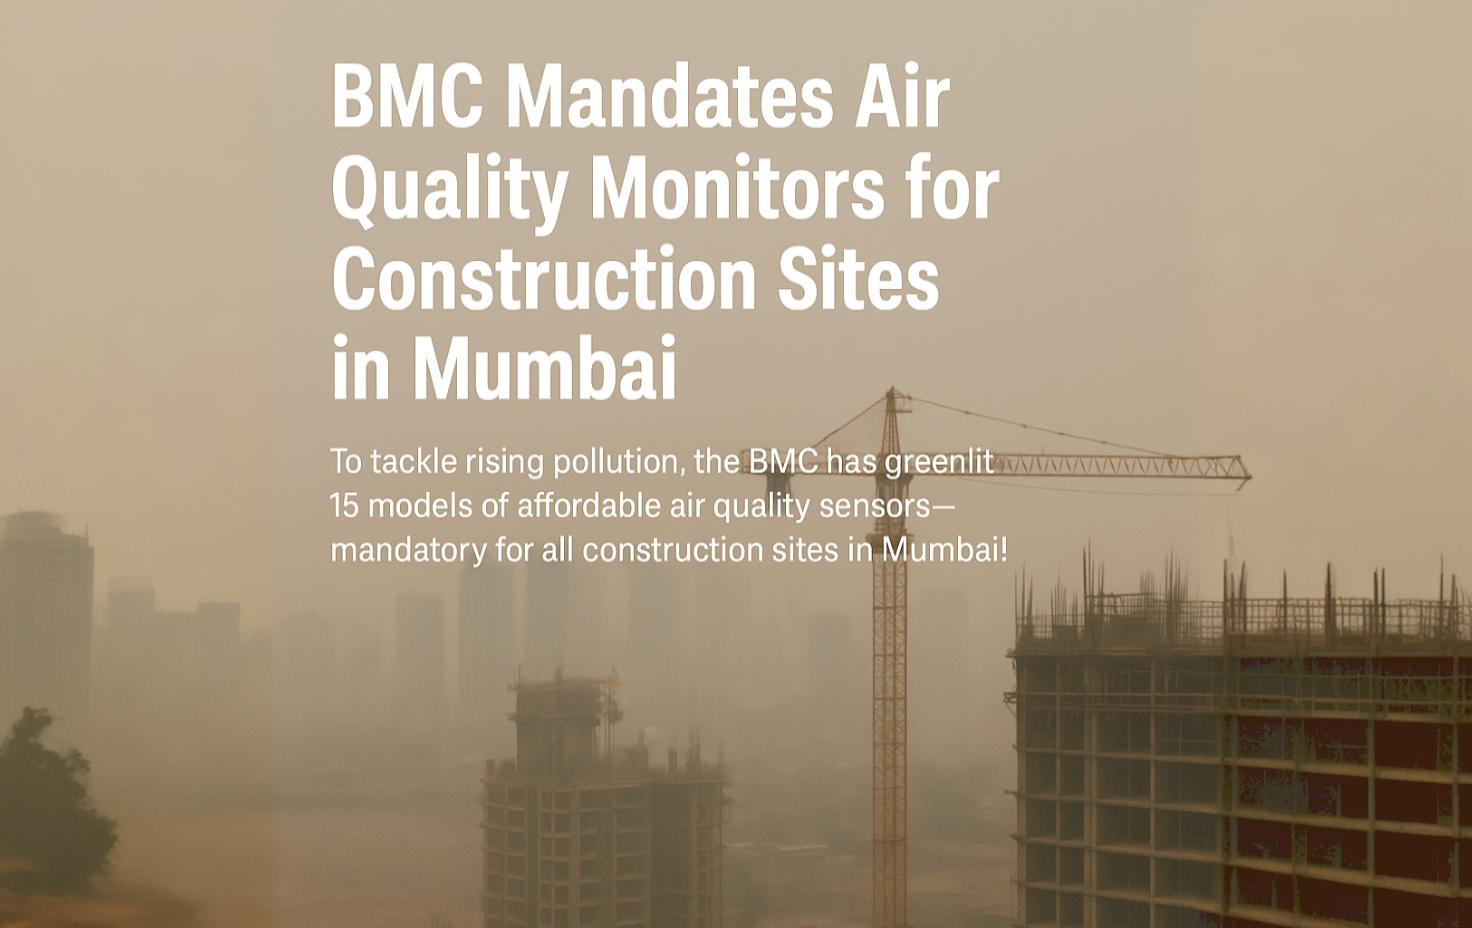
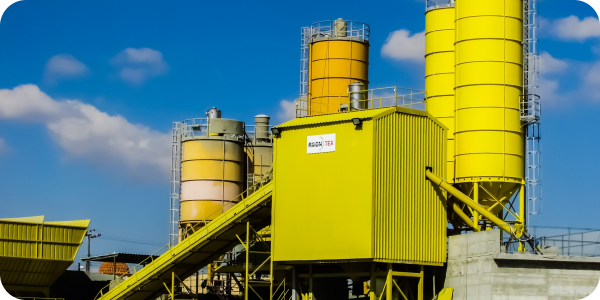
Big news! The BMC now requires all large construction sites in Mumbai to install air quality monitors.

Heatwaves News: Delhi's current temperature is 40˚C, but it feels like burning at 50˚C.

The Mask Returns: COVID Cases Spike in Singapore, Hong Kong, and India
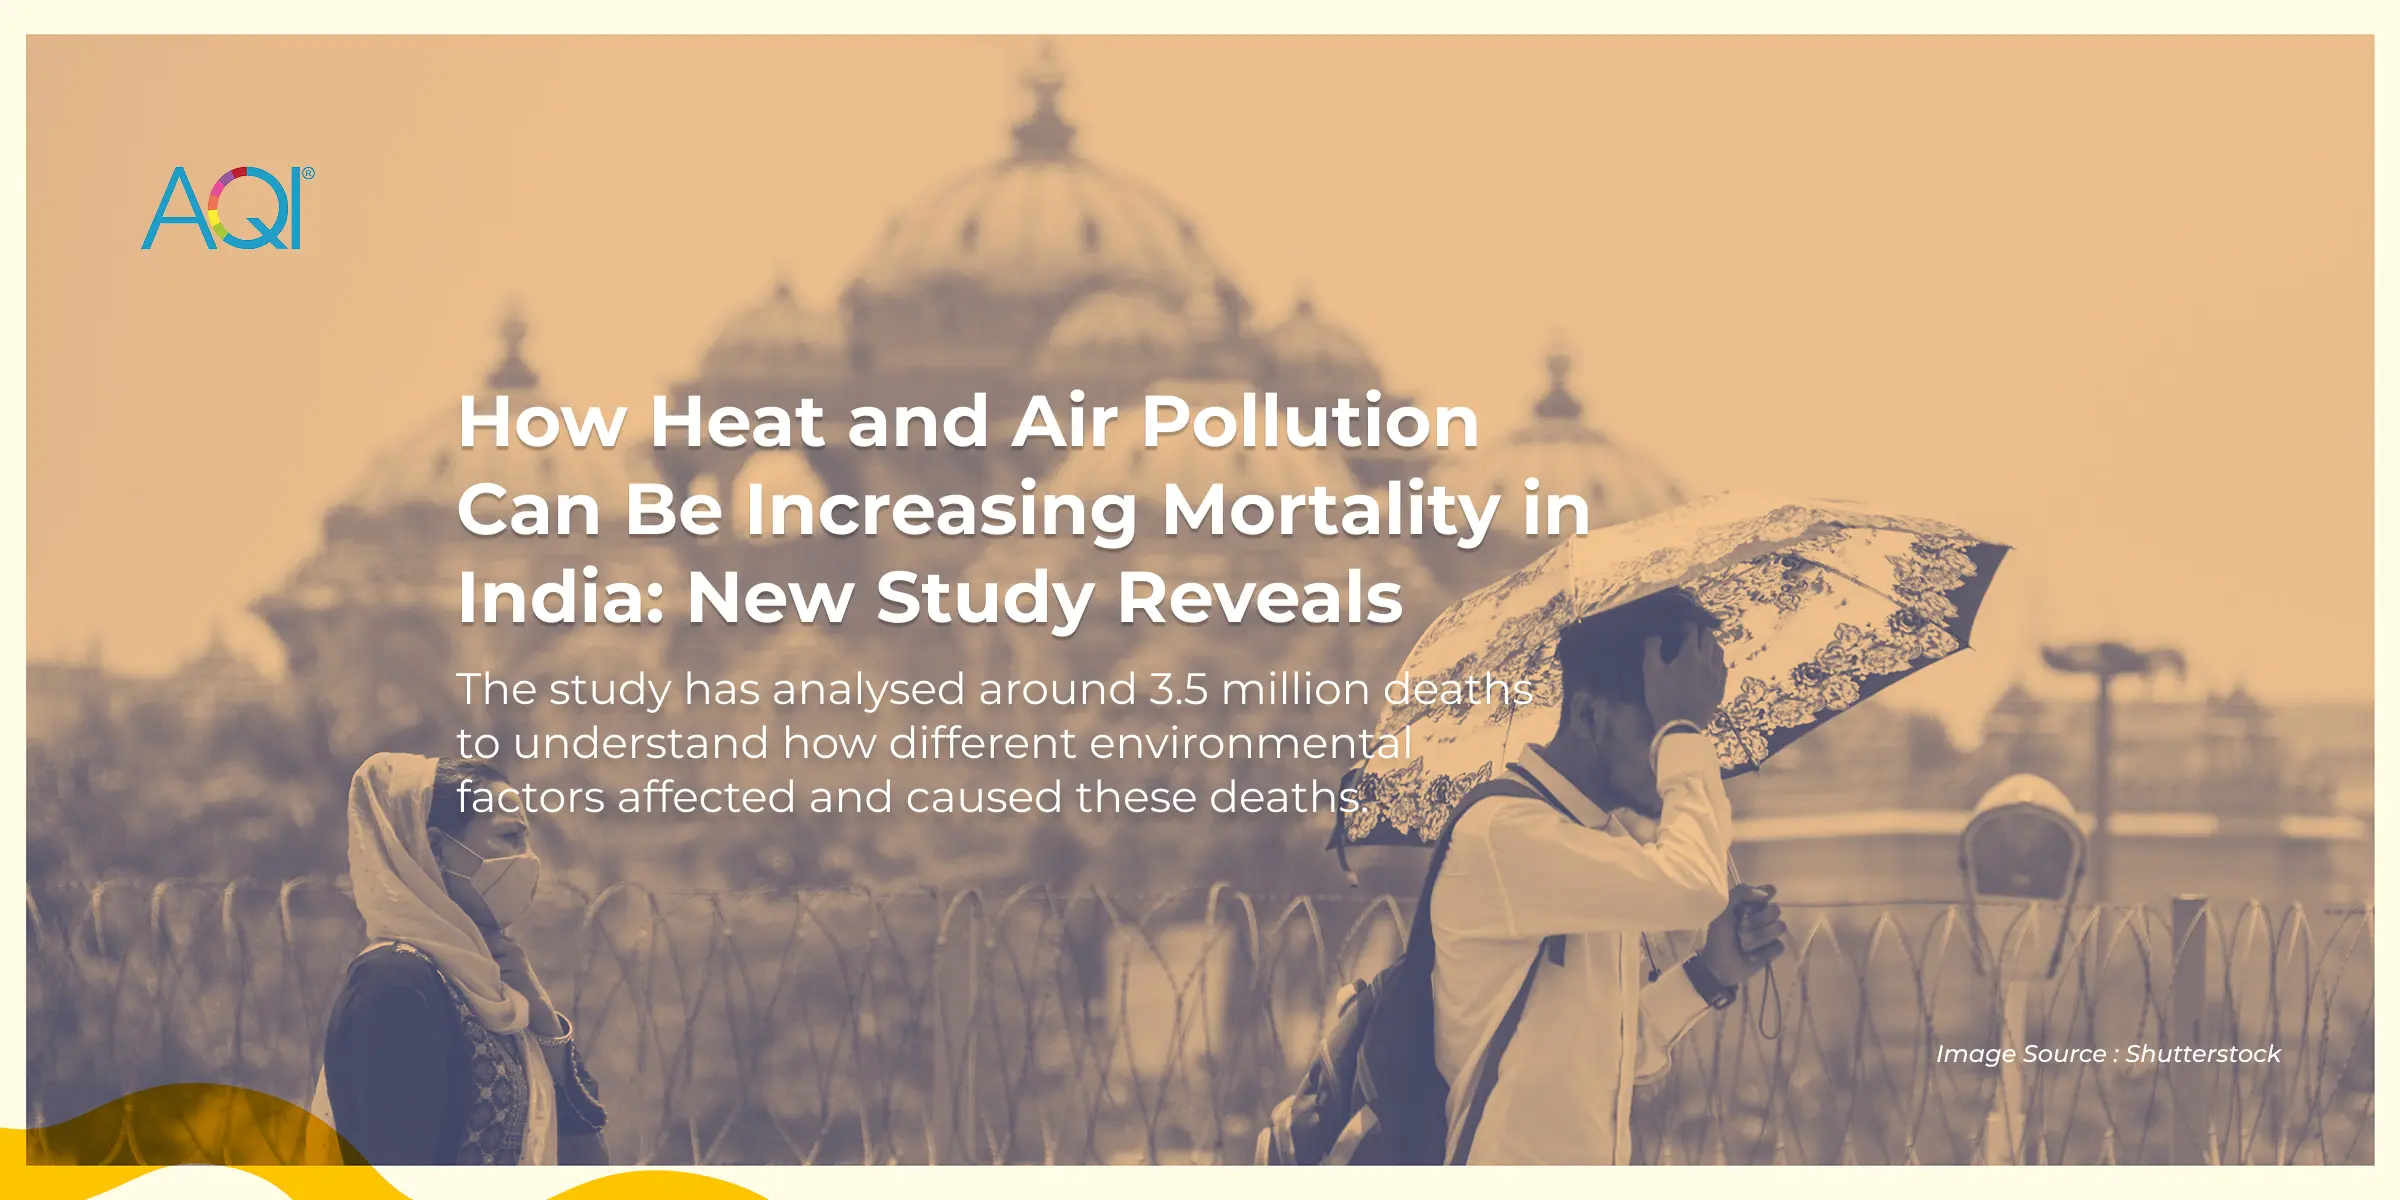
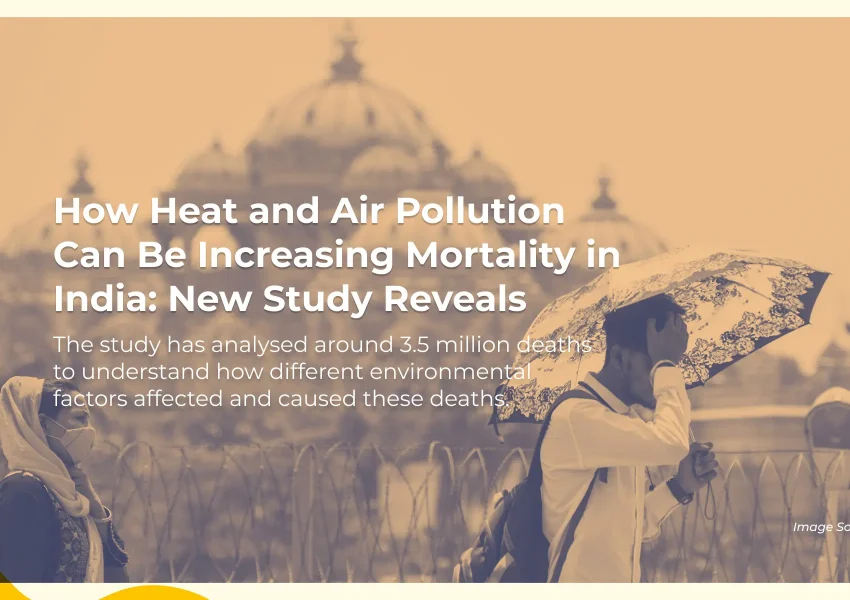
How Heat and Air Pollution Can Be Increasing Mortality in India: New Study Reveals
AQI Levels in New Delhi at Alarming Levels Due to Thick Layer of Dust
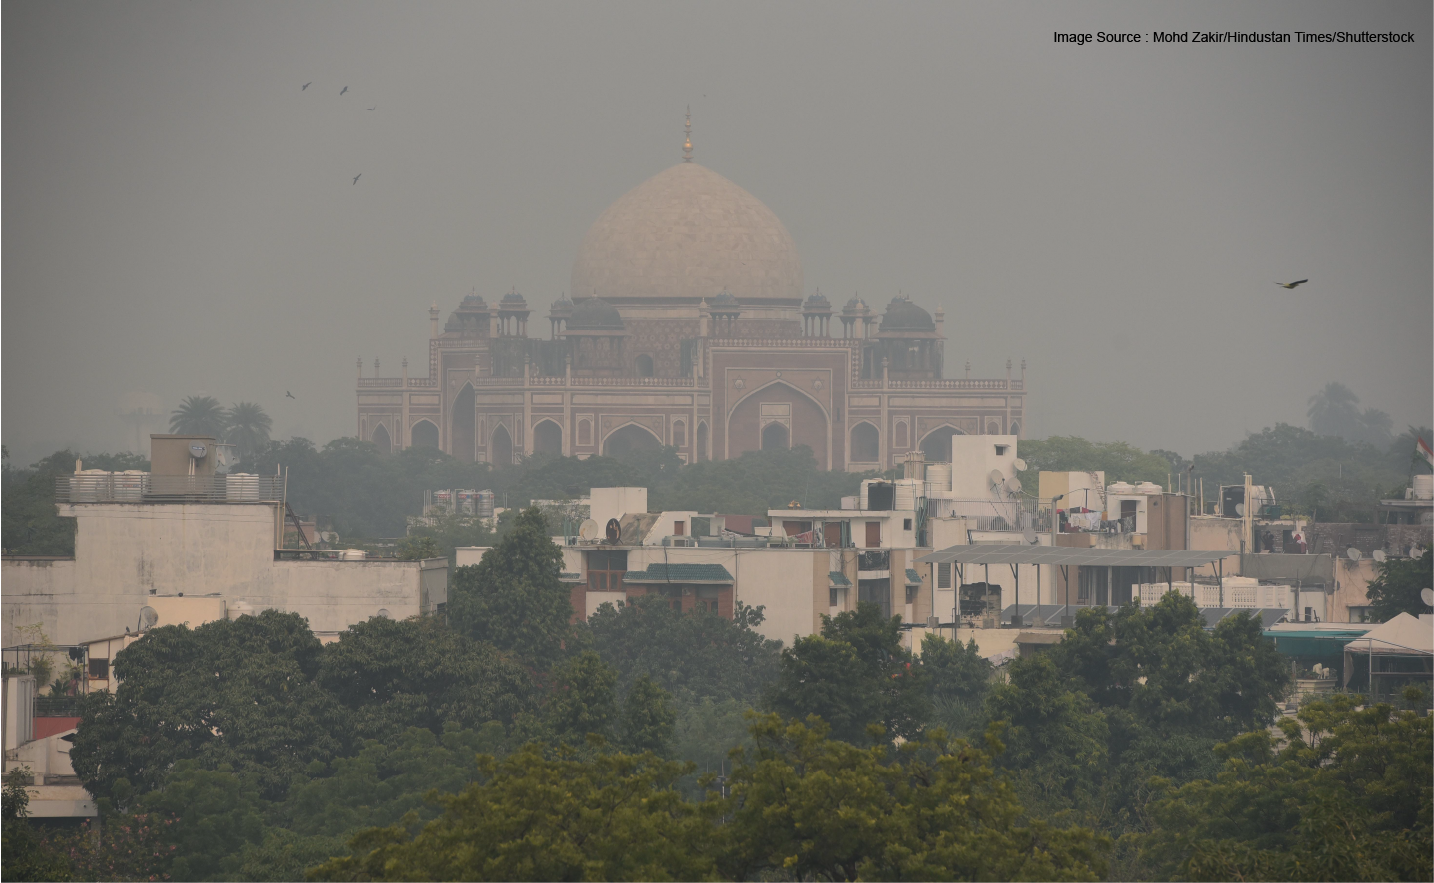
Breaking Today: A Layer of Thick Smog and Dust Covers New Delhi – Visibility Drops
Long-Term Exposure to Polluted Air and Its Impact on Heart Health: A Global Perspective
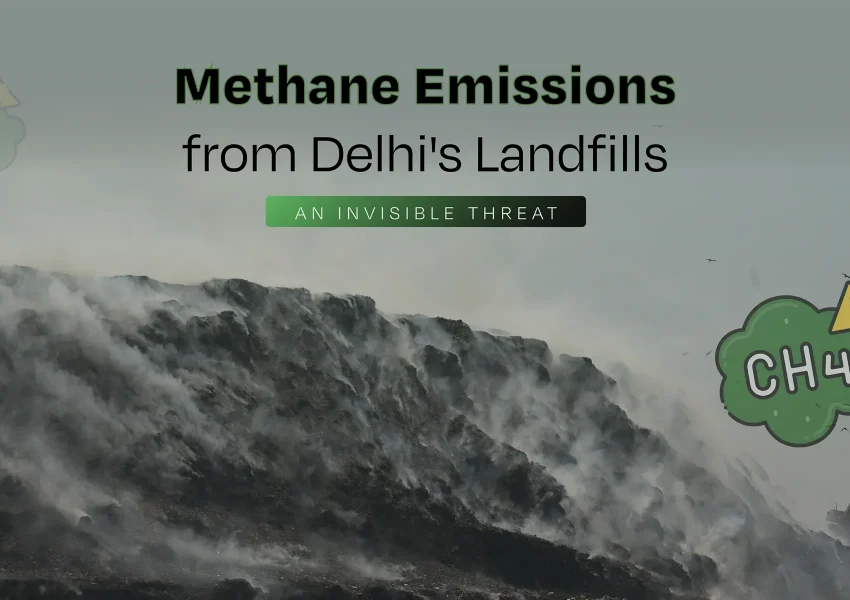
Methane Emissions from Delhi’s Landfills: An Invisible Threat
-or-pm2.5.webp)
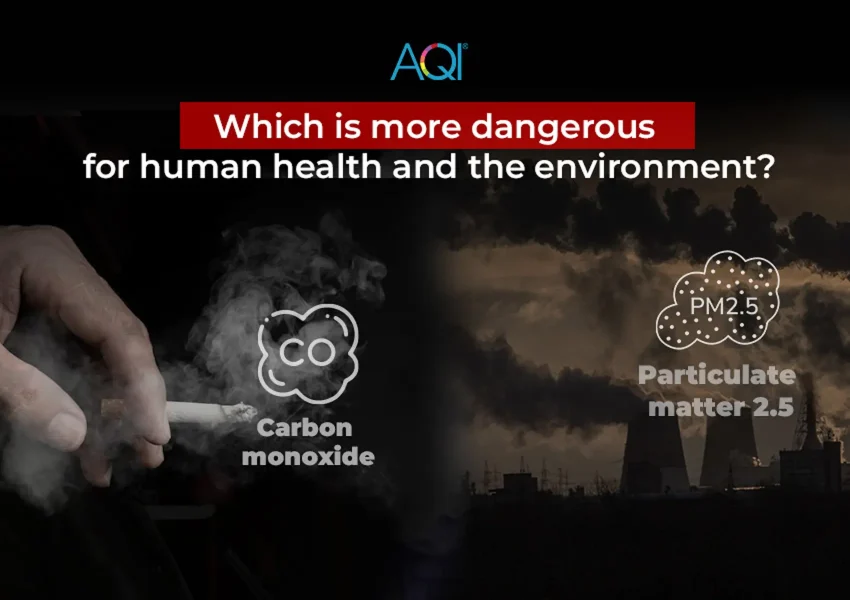
Carbon monoxide (CO) or PM2.5: Which is more dangerous for human health and the environment?
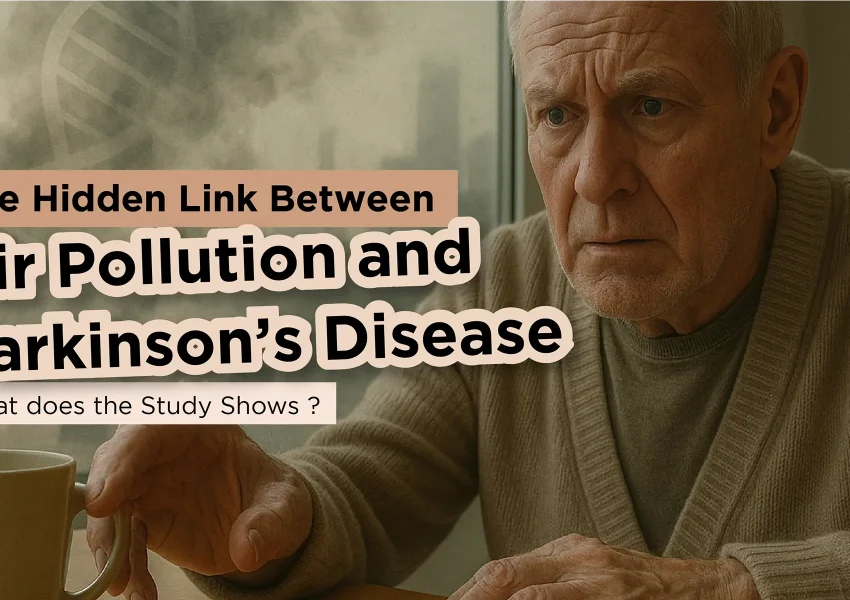
The Hidden Link Between Air Pollution and Parkinson’s Disease: What the Study Shows?

IS AIR POLLUTION SOLELY OUR FAULT? DEBUNKING THE MYTH WITH HARD TRUTH
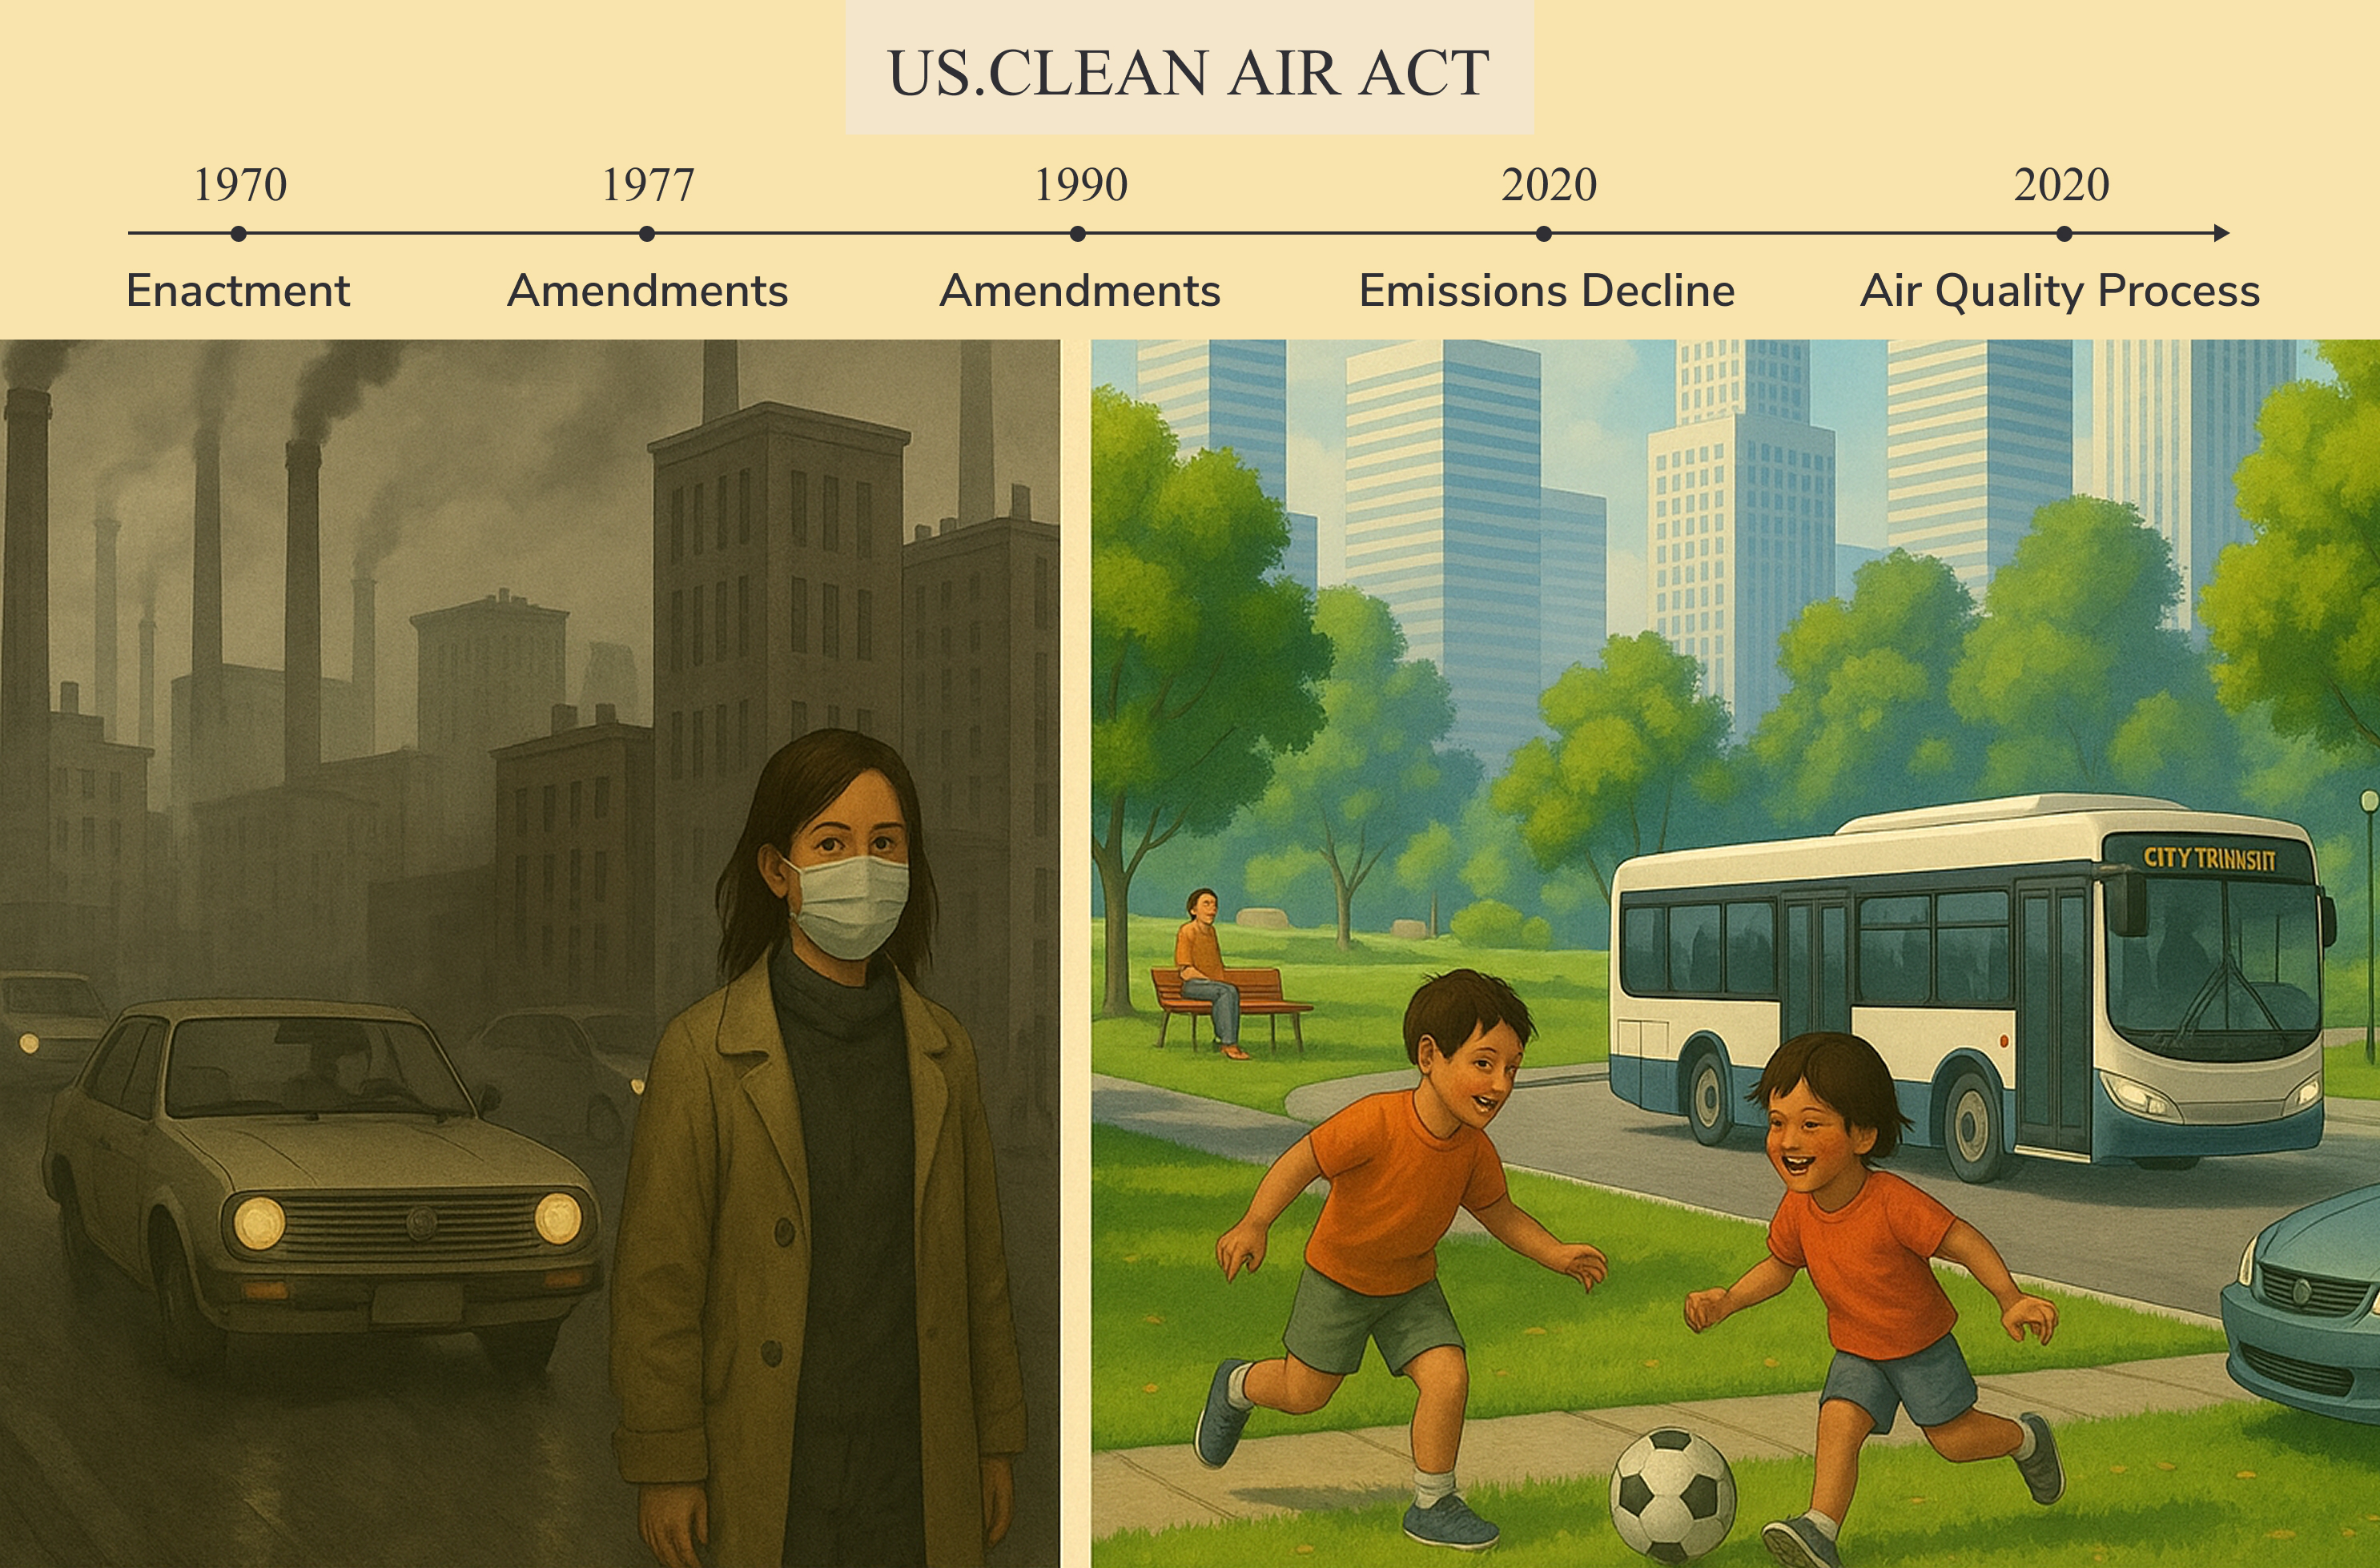
From Smog to Songbirds: How the U.S. Clean Air Act Cleared the Skies
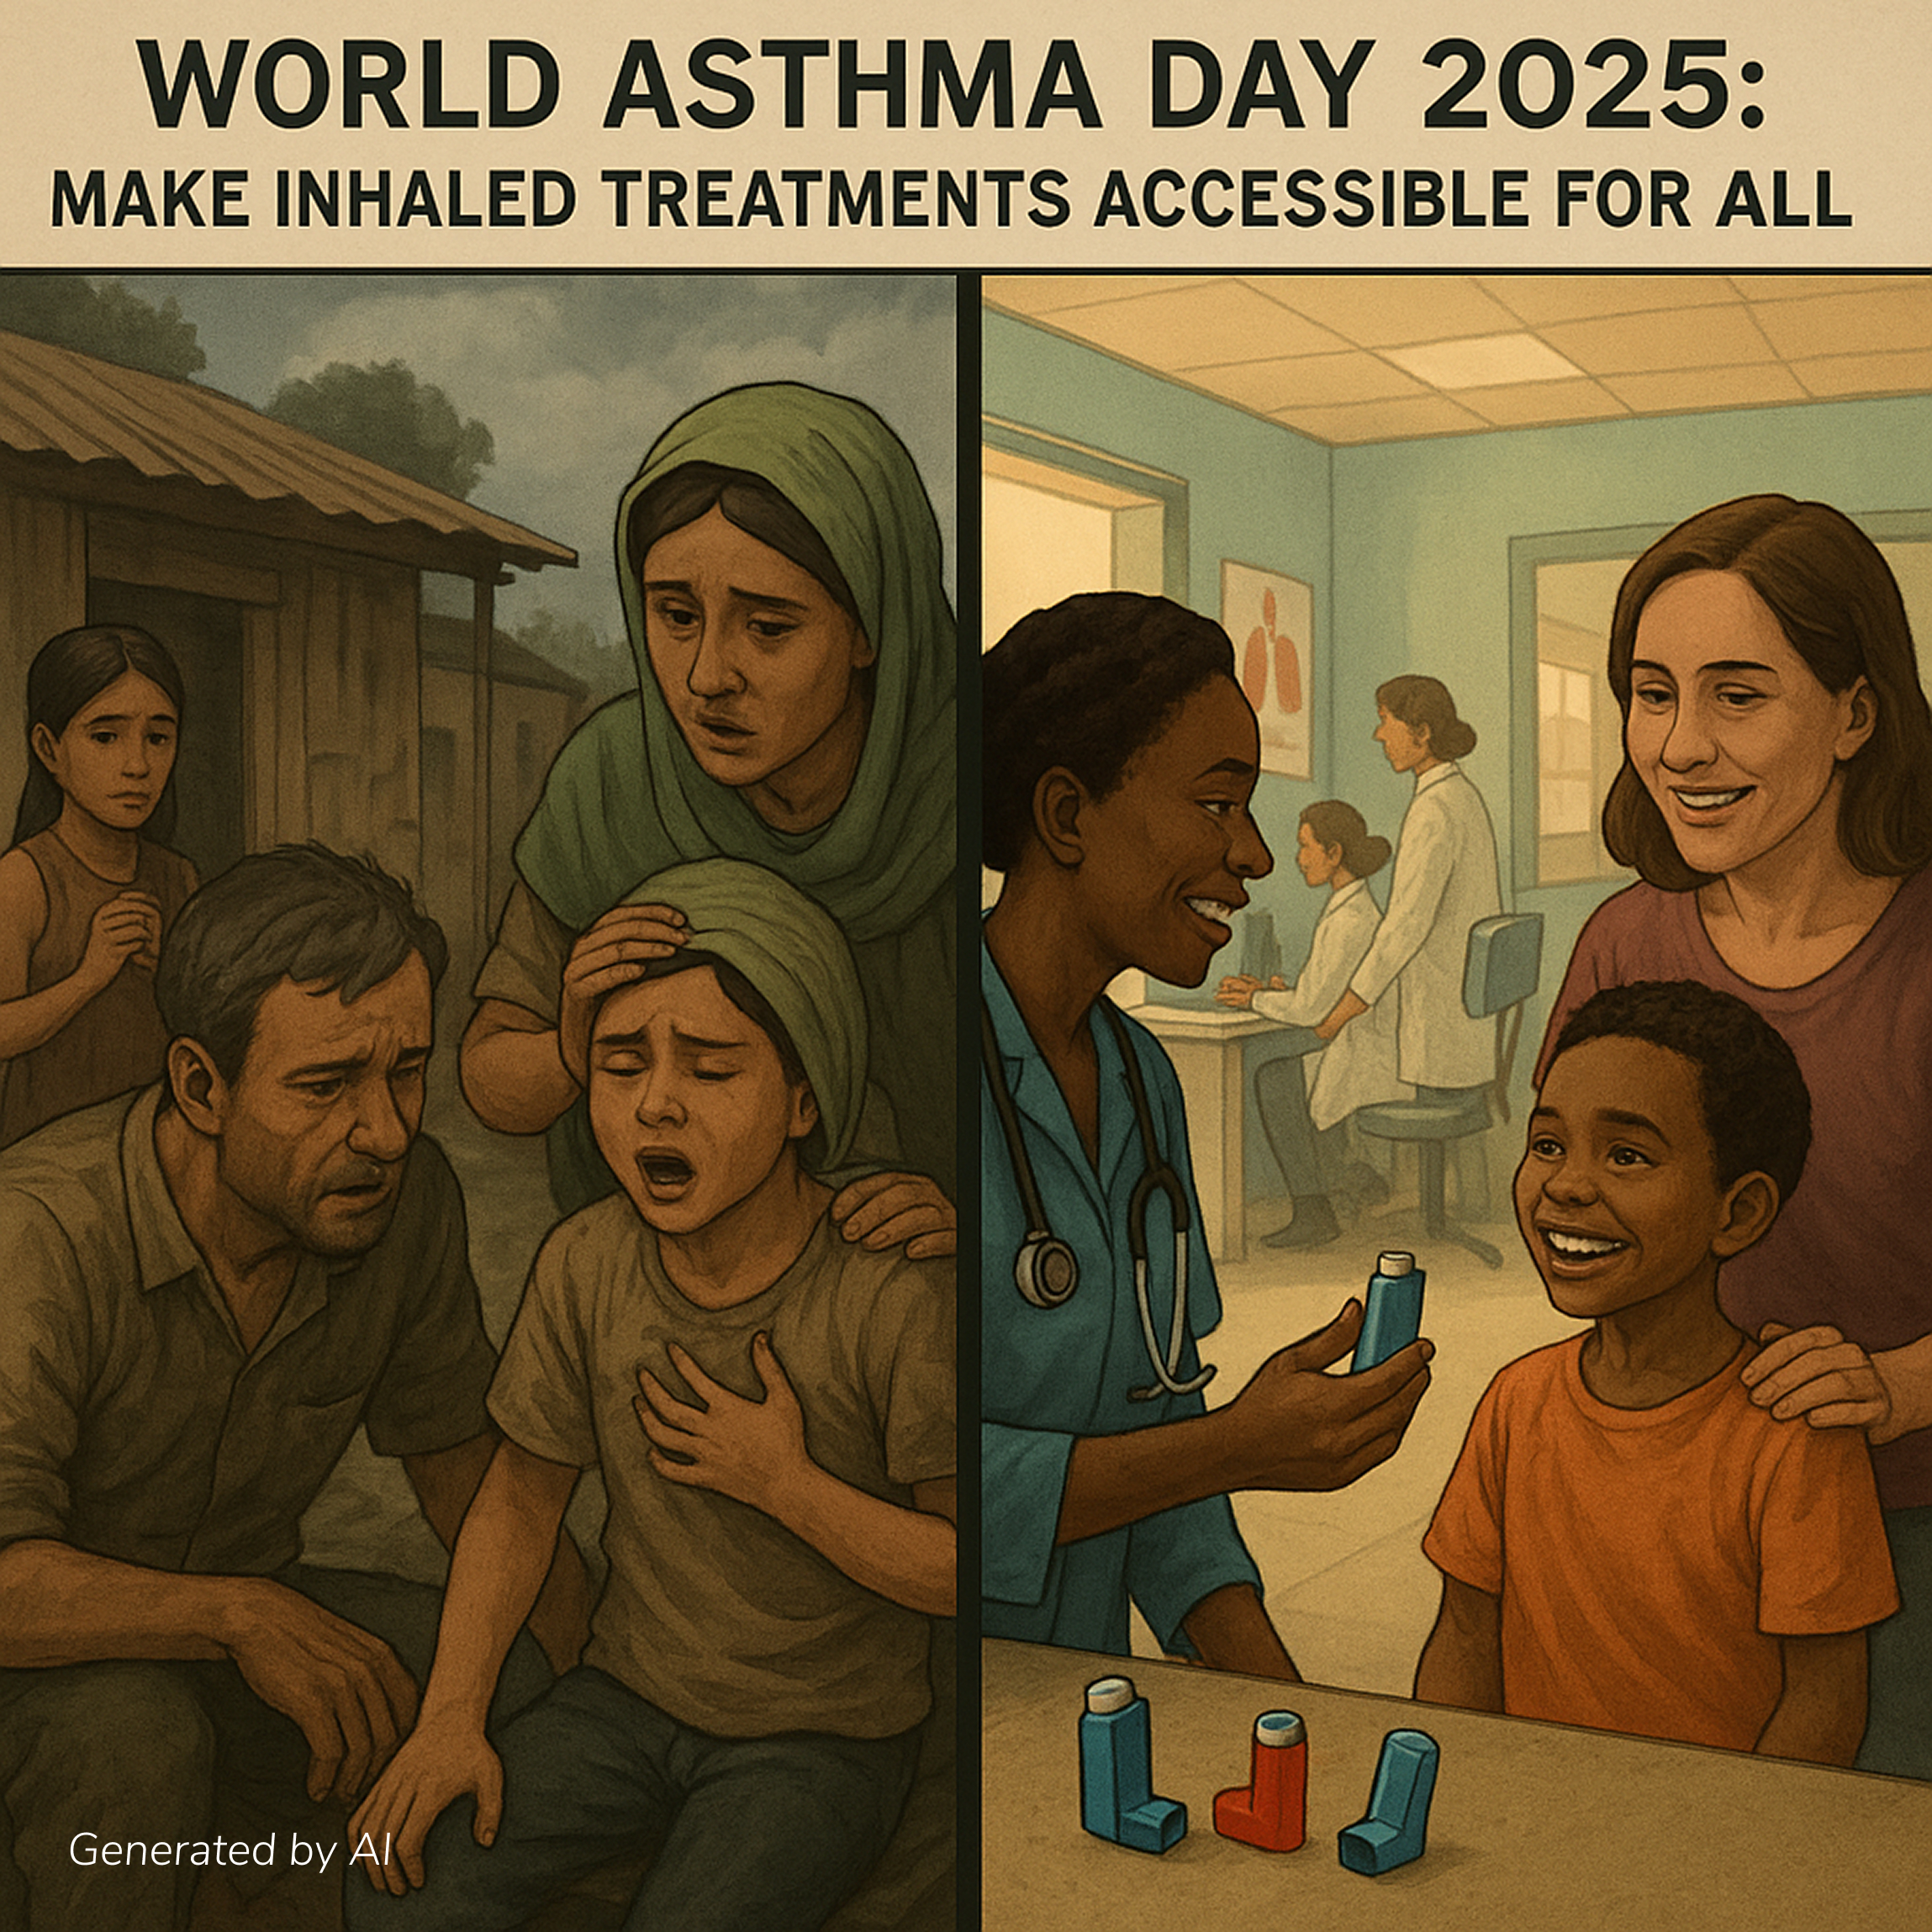
Two Worlds, One Breath: World Asthma Day 2025 and the Link Between Air Pollution and Asthma
.jpg)
Case Study : How Prana Air Helped the American School of Bombay in Improving Air Quality?
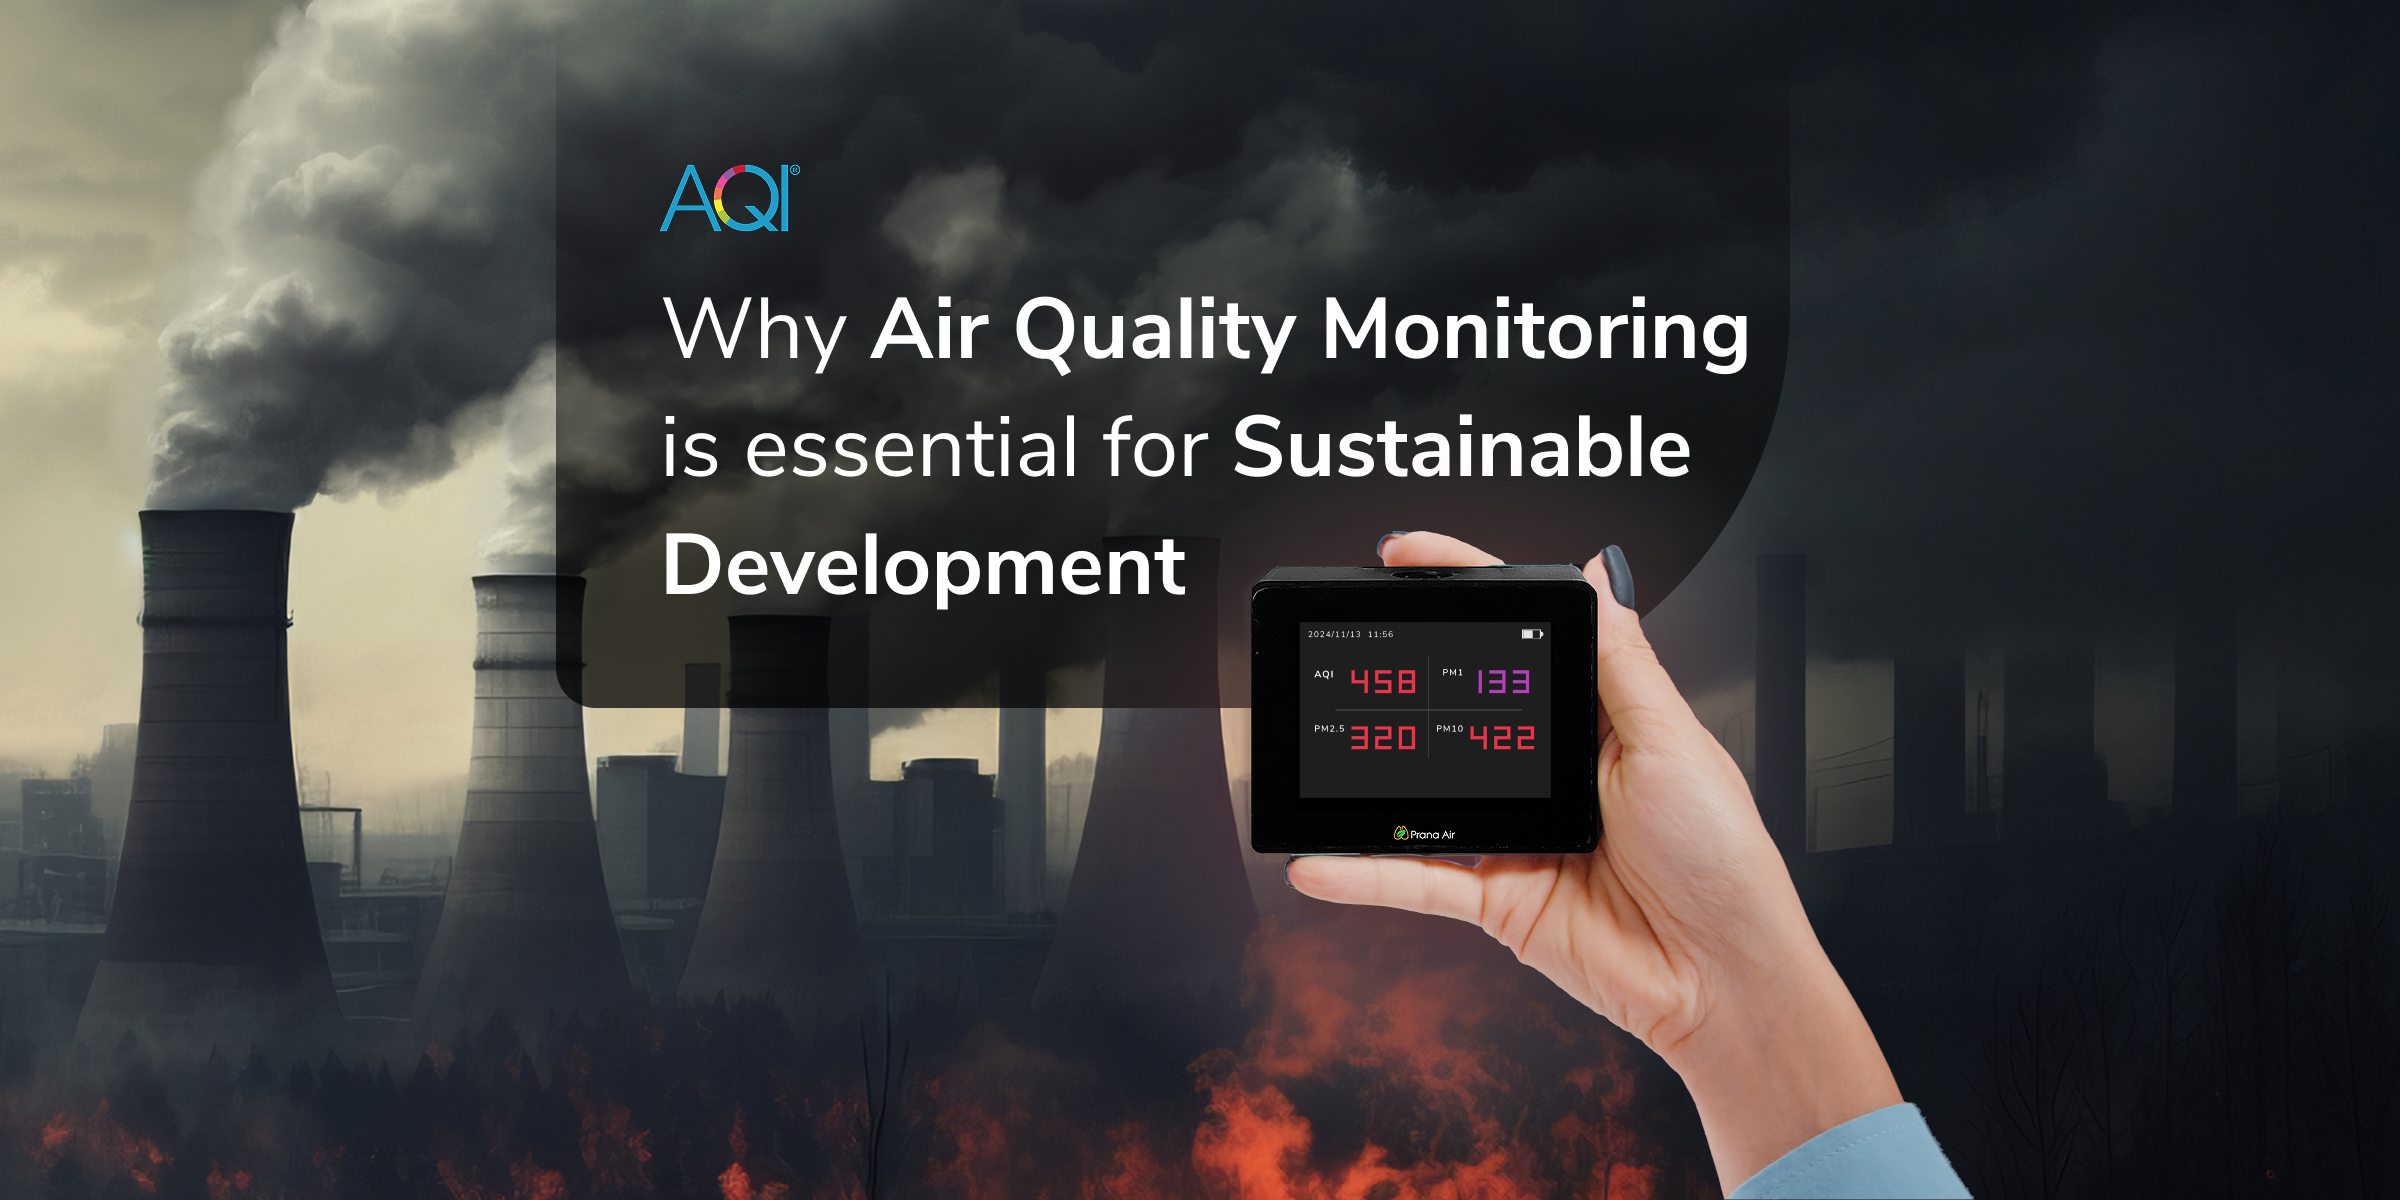
Why Air Quality Monitoring is Essential for Sustainable Development: Key Insights
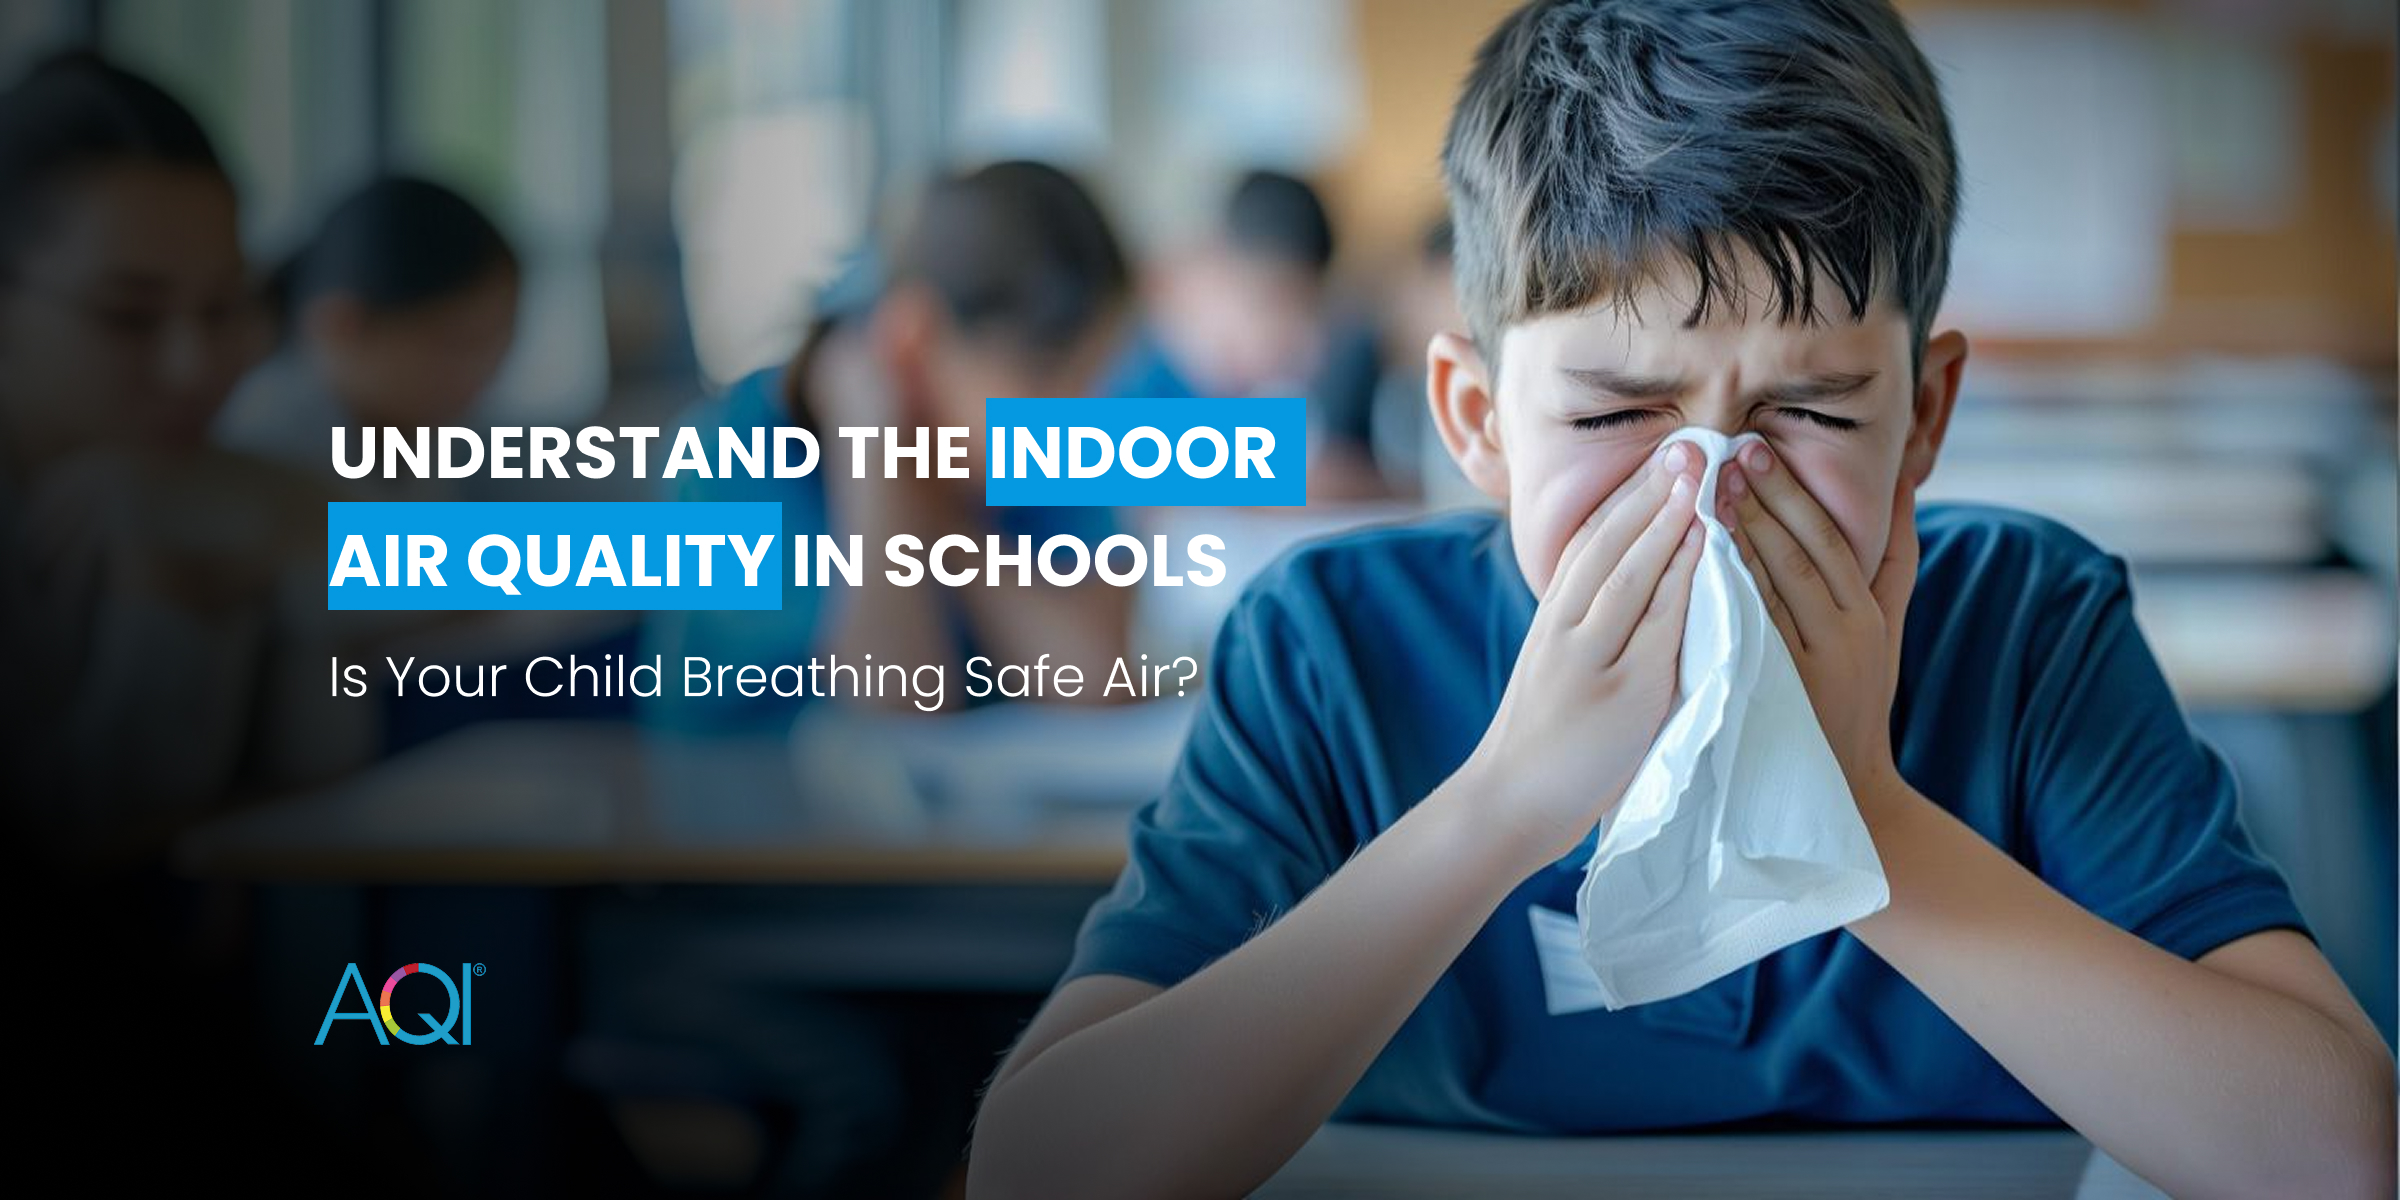
Understand the Indoor Air Quality in Schools: Is Your Child Breathing Safe Air?

Sleep Interrupted: How Air Pollution Steals Your Res

Understanding the AQI: What the Air You Breathe Means for Your Health
AQI Graph
Historical Air Quality Data
New Delhi
Download 2024 Annual Data
World Air Quality Report
AQI Trends - Annual Air Quality Changes
New Delhi, Delhi, India
Annual AQI Trends
Most & Least Polluted Months
* This data analysis is from year 2020 - 2025
New Delhi's Locations
Real-time Air Pollution Level
India's Metro Cities
Air Quality Index


Air Quality Calendar 2025
New Delhi
Health Advice For People Living In
New Delhi
2.4Cigarettes per day

Breathing the air in this location is as harmful as smoking 2.4 cigarettes a day.
Source:
Berkeley Earth
Solutions for Current AQI
 Air PurifierTurn On
 Car FilterMust
 N95 MaskMust
 Stay IndoorMust
Must turn on the air purifier to enjoy fresh air.
Prevent Health Problems: Understand Your Risks
New Delhi
 Asthma
 Heart Issues
 Allergies
 Sinus
Sinus Cold/Flu
 Chronic (COPD)

Mid. Chances of Asthma
Asthma
Risk of Asthma symptoms is Mid. when AQI is Poor (50-150)
Moderate symptoms including frequent wheezing, noticeable shortness of breath, chest tightness, and persistent cough.
Do's :
Limit outdoor activities when AQI is poor.
Clean indoor air with an air purifier to reduce exposure.
Soothe the respiratory tract with herbal teas or warm water to help alleviate symptoms.
Don'ts :
Exercise outdoors without a mask.
Stay in smoky areas with strong fumes.
Most Polluted Cities 2025
India
Analyze the real-time most air polluted cities in the country.
Standard Value
1.
Pali, India
2.
Kullu, India
3.
Jodhpur, India
4.
Kota, India
5.
Faridabad, India
6.
Gwalior, India
7.
Fatehgarh Sahib, India
8.
Bhiwadi, India
9.
Ghaziabad, India
10.
Dharuhera, India
Last Updated: 29 May 2025, 09:38 PM
AQI City RankingsAbout New Delhi Air Pollution
New Delhi Monthly AQI Analysis
Explore the AQI changes as a comparison from the past month, as well as how it differs from the same month last year
May 2024 vs May 2025
Compared to May 2024, the AQI in May 2025 changed from Unhealthy to Poor.
Apr. 2025 vs May 2025
AQI levels changed from 'Unhealthy' in Apr. 2025 to 'Poor' in May 2025.
New Delhi's annual 2025 AQI (164) shows an average percentage change of 0.09% (worsened AQI) compared to previous years: 2020 (153), 2021 (162), 2022 (174), 2023 (164), 2024 (169).


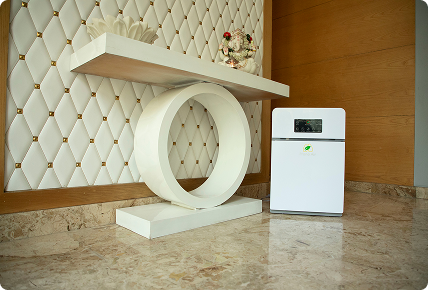

Air Quality Solutions For New Delhi
Explore the solutions of air quality monitoring & clean air.
Here are some applications that you can go through to find out the solutions.


New Delhi's AQI Data Analytics Solutions
Air quality data monitoring platforms
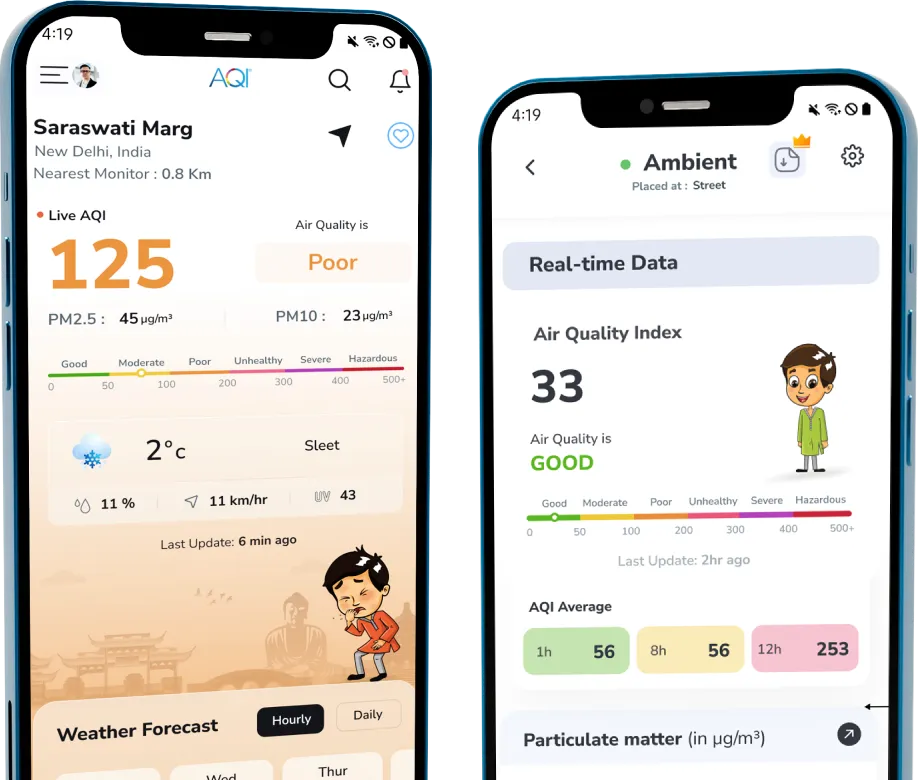
Empower Your Decisions with Reliable Data
Your area’s real-time data with detailed parameters.
Personalized health advice as per current AQI.
Analytical data to identify trends and conditions.
Connect and control your air quality devices.
Air Quality FAQs
at New Delhi
Frequently Asked Questions About Air Quality
What is the current AQI level in New Delhi?
The current real-time AQI level in New Delhi is 134 (Poor). This was last updated 2025-05-30 02:55:42 AM (Local Time).
When was the best AQI level in New Delhi in the last 24 hours?
The best AQI level was 115 (Poor) at 1:09 PM (Local Time) during the last 24 hours.
When was the worst AQI level in New Delhi in the last 24 hours?
The worst AQI level was 164 (Unhealthy) at 8:09 AM (Local Time) during the last 24 hours.
What is the current trend of AQI levels in New Delhi during last 24 hours?
The AQI levels in New Delhi have been fluctuating throughout the last 24 hours. The levels have increased by highest 164 at 8:09 AM (Local Time), lowest 115 at 1:09 PM (Local Time).
What actions are recommended as per the current AQI level in New Delhi?
Current AQI levels are unhealthy for Sensitive individuals, they should reduce prolonged or heavy outdoor exertion.
Recent AQI Blogs
Read the latest news
Here are some latest blogs that you can go through to find out more air pollution.


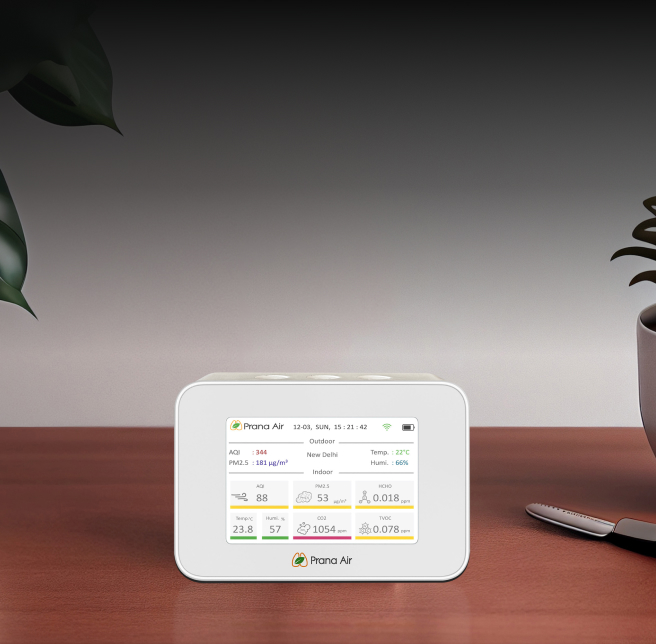
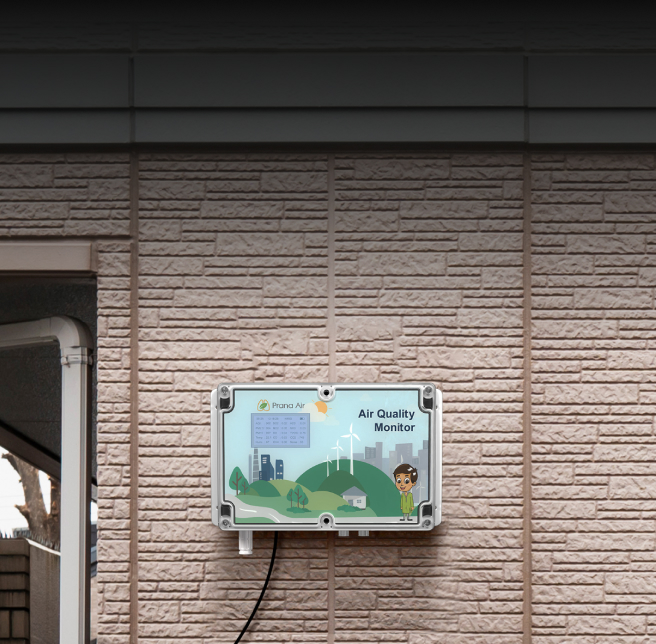
Prana Sense
Air Quality Monitor
Air Quality Index depicts the extent of air pollution at a particular location.

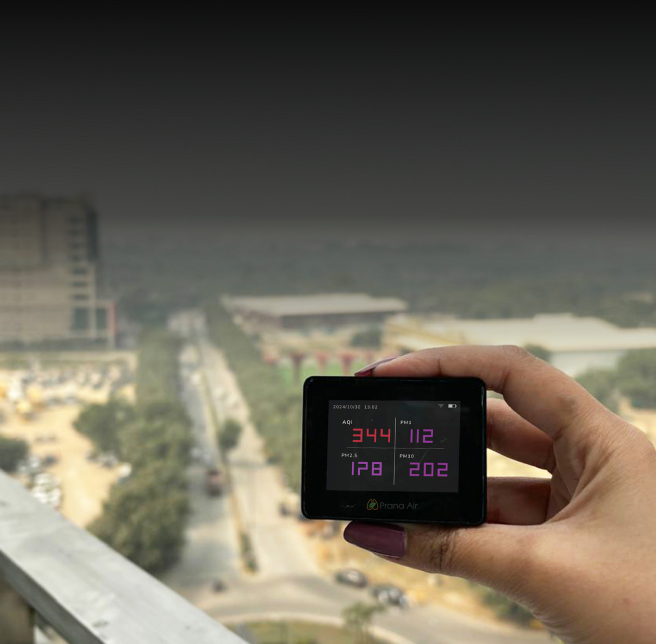
Pocket PM
Air Quality Monitor
Know the air quality around you wherever you are with the Pocket monitor to get instant air quality insights.

Cair +
Indoor Air Quality Monitor
Track indoor air quality with advanced connectivity and portability for real-time air quality data.