Live

New Delhi Air Quality Index (AQI) | Air Pollution

Real-time PM2.5, PM10 air pollution level in Delhi

Last Updated: 2025-05-29 06:11:01 AM (Local Time)

location image
Live AQI
157
Air Quality is
Unhealthy
pm10 :  147 µg/m³
PM2.5 :  65 µg/m³
Good
050
Moderate
100
Poor
150
Unhealthy
200
Severe
300
Hazardous
301+
aqi unhealthy level in New Delhi
mist

30 °C

Mist
Humidity
Humidity75 %

Wind Speed
Wind Speed9 km/h

UV Index
UV Index0
Last Updated: 2025-05-29 06:11:01 AM (Local Time)


Map

New Delhi

Major Air Pollutants

New Delhi

AQI Graph

Historical Air Quality Data

New Delhi

New Delhi

Download 2024 Annual Data

World Air Quality Report

Globe

AQI Trends - Annual Air Quality Changes

New Delhi, Delhi, India

Year
.
AQI


Annual AQI Trends

2020
153AQI
2021
162AQI
6%
Rise
2022
174AQI
7%
Rise
2023
164AQI
-6%
Fall
2024
169AQI
3%
Rise
2025
164AQI
-3%
Fall
Overall Annual Percentage (%) change of AQI in (2020 to 2025)
1%
Rise (Worsened AQI)

Most & Least Polluted Months

Most PollutedNovember, 2021290AQI

Least PollutedAugust, 202073AQI

* This data analysis is from year 2020 - 2025

New Delhi's Locations

Real-time Air Pollution Level

Location
Status
AQI
PM2.5(µg/m³)
PM10(µg/m³)
Temp.(°C)
Humi.(%)
Aerocity
Unhealthy
158
65
125
30
74
Alaknanda
Unhealthy
159
67
147
30
75
Alipur
Unhealthy
162
71
160
30
74
Anand Lok
Unhealthy
158
65
164
30
75
Anand Parbat
Unhealthy
157
65
153
30
75
Anand Vihar
Unhealthy
165
75
97
30
75
Ashok Vihar Phase 1
Unhealthy
160
69
153
30
75
Ashok Vihar Phase 2
Unhealthy
168
80
158
30
75
Ashok Vihar Phase 3
Unhealthy
157
64
153
30
75
Ashok Vihar Phase 4
Unhealthy
157
64
153
30
75
Bali Nagar
Unhealthy
158
66
162
30
75
Bawana Industrial Area
Unhealthy
162
71
155
30
73
Bhalswa Landfill
Unhealthy
162
72
158
30
75
Bramprakash Ayurvedic Hospital
Poor
120
43
111
30
73
Chanakya Puri
Unhealthy
159
67
153
30
75
Civil Lines
Unhealthy
158
66
170
30
74
Connaught Place
Unhealthy
157
64
153
30
75
Darya Ganj
Unhealthy
155
62
160
30
75
Deepali
Unhealthy
169
80
162
30
75
Defence Colony
Unhealthy
157
64
163
30
75
Delhi Cantt
Unhealthy
158
65
126
30
75
Delhi Gymkhana Club
Unhealthy
159
67
155
30
75
Delhi Institute Of Tool Engineering
Unhealthy
162
71
180
30
75
Diplomatic Enclave
Unhealthy
159
67
153
30
75
Dite Okhla
Unhealthy
159
67
153
30
75
DR Karni Singh Shooting Range
Unhealthy
159
67
153
30
75
Dwarka
Poor
128
47
143
30
75
Dwarka Sector 10
Poor
131
48
142
30
75
Dwarka Sector 11
Poor
128
47
143
30
75
Dwarka Sector 12
Poor
131
48
142
30
75
Dwarka Sector 18B
Unhealthy
152
57
147
30
75
Dwarka Sector 23
Poor
138
51
140
30
75
Dwarka Sector 3
Unhealthy
152
57
146
30
75
Dwarka Sector 5
Unhealthy
152
57
147
30
75
Dwarka Sector 6
Unhealthy
158
65
155
30
75
Dwarka Sector 7
Unhealthy
152
57
120
30
75
East Patel Nagar
Unhealthy
160
68
189
30
75
Embassy of Belgium
Unhealthy
159
67
153
30
75
Ghazipur
Unhealthy
155
61
104
30
75
Golf Links
Unhealthy
158
66
148
30
75
Govind Puri
Unhealthy
159
67
153
30
75
Greater Kailash
Unhealthy
159
67
153
30
75
Greater Kailash II
Unhealthy
159
67
147
30
75
Green Park
Unhealthy
156
62
151
30
74
GTB Nagar
Unhealthy
169
81
144
30
75
Gulmohar Park Block B
Unhealthy
156
62
154
30
75
Hari Nagar
Unhealthy
158
66
160
30
75
Hastsal
Unhealthy
152
57
145
30
75
Hauz Khas
Unhealthy
159
67
153
30
75
Hazrat Nizamuddin
Unhealthy
156
63
122
30
75
HT House
Unhealthy
157
64
153
30
75
I P Extension
Unhealthy
156
63
120
30
75
Inderlok
Unhealthy
169
81
158
30
75
Institute of Human Behaviour and Allied Sciences
Poor
148
55
143
30
75
ITI Jahangirpuri
Unhealthy
157
64
154
30
75
ITI Shahdra
Unhealthy
154
60
121
30
75
Janakpuri
Unhealthy
161
70
129
30
74
Jangpura
Unhealthy
154
60
154
30
75
Jawaharlal Nehru Stadium
Unhealthy
157
64
152
30
75
Kalkaji
Unhealthy
159
67
153
30
75
Karol Bagh
Unhealthy
158
65
153
30
74
Kashmiri Gate ISBT
Unhealthy
157
64
182
30
74
Katwaria Sarai
Unhealthy
157
64
123
30
75
Kohat Enclave
Unhealthy
169
81
158
30
75
Lajpat Nagar
Poor
148
55
160
30
75
LIC Colony
Unhealthy
167
78
130
30
75
Major Dhyan Chand National Stadium
Unhealthy
158
65
164
30
75
Malviya Nagar
Unhealthy
157
64
130
30
75
Mandir Marg
Unhealthy
158
65
153
30
73
Mayur Vihar
Poor
144
53
110
30
75
Model Town
Unhealthy
160
68
158
30
75
Mori Gate
Unhealthy
156
63
151
30
74
Mukherjee Nagar
Unhealthy
168
79
161
30
73
Mundka
Unhealthy
154
60
155
30
75
Mustafabad
Unhealthy
159
67
150
30
75
Najafgarh
Poor
136
50
140
30
74
Naraina Industrial Area
Unhealthy
157
64
153
30
75
Narela
Unhealthy
162
71
148
30
74
National Institute Of Malaria Research
Unhealthy
158
65
130
30
75
New Delhi US Embassy
Unhealthy
156
62
152
30
74
New Delhi US Embassy
Unhealthy
156
62
152
30
74
New Friends Colony
Unhealthy
158
65
163
30
75
New Sarup Nagar
Unhealthy
161
69
151
30
75
Niti Marg
Unhealthy
159
67
153
30
75
Okhla Phase II
Unhealthy
159
67
153
30
75
Panchsheel Vihar
Unhealthy
159
67
153
30
75
Paschim Vihar
Unhealthy
166
77
122
30
75
Patparganj
Poor
148
55
114
30
75
PGDAV College
Poor
150
55
160
30
75
Pooth Khurd
Unhealthy
162
71
155
30
75
Prashant Vihar
Unhealthy
162
71
151
30
75
Punjabi Bagh
Unhealthy
158
65
132
30
75
Punjabi Bagh Block D
Unhealthy
155
62
151
30
75
Pusa
Unhealthy
160
68
189
30
75
Radhey Mohan Drive
Unhealthy
156
62
119
30
75
Radhey Mohan Drive 2
Unhealthy
156
63
121
30
75
Raghubir Nagar
Unhealthy
158
65
164
30
75
Rajinder Nagar
Unhealthy
159
66
125
30
75
Ramesh Park
Unhealthy
152
57
119
30
74
RK Puram
Unhealthy
151
56
149
30
75
RK Puram North Block
Unhealthy
151
56
150
30
75
Rohini Sector 10
Unhealthy
169
81
161
30
75
Rohini Sector 15
Unhealthy
169
81
161
30
75
Rohini Sector 24
Unhealthy
168
80
165
30
75
Rohini Sector 30
Unhealthy
162
71
160
30
73
Rohini Sector 5
Unhealthy
169
80
161
30
75
Rohini Sector 7
Unhealthy
169
81
161
30
75
Ruchi Vihar
Unhealthy
152
57
124
30
73
Safdarjung Enclave
Unhealthy
156
62
153
30
75
Sainik Farms
Unhealthy
158
65
151
30
74
Saket
Unhealthy
159
67
153
30
75
Saket Block C
Unhealthy
157
64
130
30
75
Saraswati Marg
Unhealthy
161
70
152
30
74
Satyawati College
Unhealthy
157
64
154
30
75
Shahdara
Unhealthy
155
61
145
30
75
Shaheed Sukhdev College Of Business Studies
Unhealthy
163
72
158
30
75
Shalimar Bagh
Unhealthy
155
61
150
30
75
Shastri Nagar
Unhealthy
159
67
162
30
75
Sheikh Sarai
Unhealthy
159
67
153
30
75
Siddhartha Enclave
Unhealthy
151
56
153
30
75
Sir Edmund Hillary Marg
Unhealthy
159
67
153
30
75
Sonia Vihar Water Treatment Plant Djb
Unhealthy
159
67
150
30
75
Sri Auribindo Margta
Unhealthy
157
64
130
30
75
Sukhdev Vihar
Unhealthy
158
65
163
30
75
Sukhdev Vihar DDA Flats
Unhealthy
156
63
161
30
75
Surya Nagar
Unhealthy
154
60
123
30
75
Uttam Nagar
Unhealthy
153
58
143
30
75
Vasant Kunj
Unhealthy
158
65
124
29
75
Vasant Kunj Sector C
Unhealthy
158
66
126
30
75
Vasant Vihar
Unhealthy
152
57
125
30
75
Vasundhara Enclave
Unhealthy
156
63
117
30
75
Wazirpur
Unhealthy
154
60
149
30
75

India's Metro Cities

Air Quality Index

Health Advice For People Living In

New Delhi

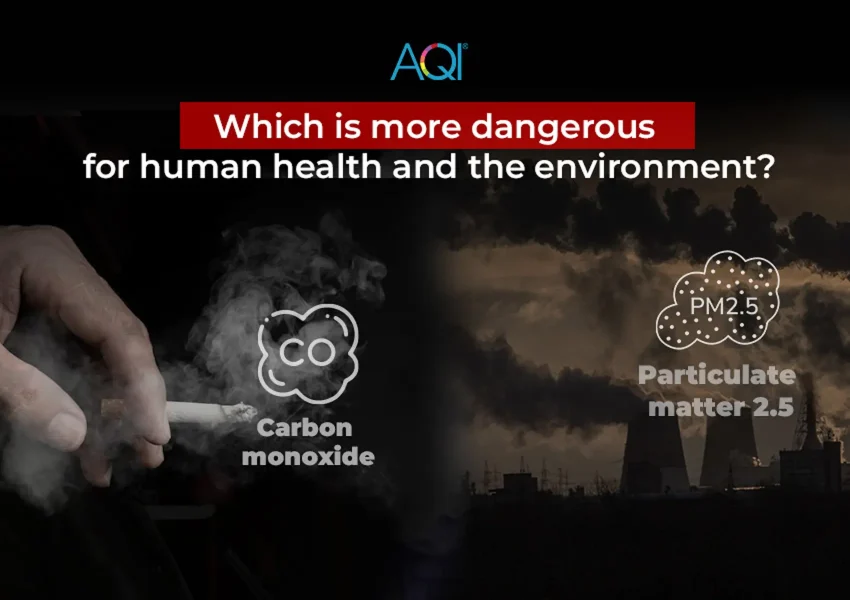
2.4Cigarettes per day

Cigarette
Weekly 16.8 Cigarettes
Monthly 72.0 Cigarettes

Breathing the air in this location is as harmful as smoking 2.4 cigarettes a day.

Source:

Berkeley Earth


Solutions for Current AQI

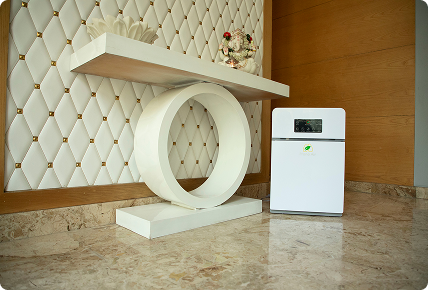
  • Air Purifier
    Air PurifierTurn On
  • Car Filter
    Car FilterMust
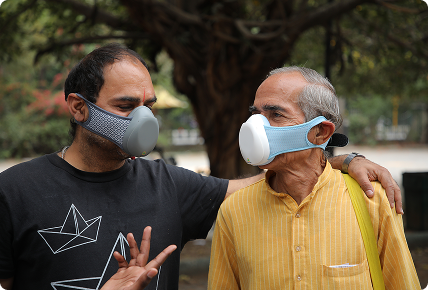
  • N95 Mask
    N95 MaskMust
  • Stay Indoor
    Stay IndoorMust


Must turn on the air purifier to enjoy fresh air.


Prevent Health Problems: Understand Your Risks

New Delhi

  • asthma due to air pollution in New DelhiAsthma
  • heart due to air pollution in New DelhiHeart Issues
  • allergy due to air pollution in New DelhiAllergies
  • sinus due to air pollution in New DelhiSinus
  • flu due to air pollution in New DelhiCold/Flu
  • copd due to air pollution in New DelhiChronic (COPD)
asthma due to air pollution in New Delhi

High Chances of Asthma

Asthma

Risk of Asthma symptoms is High when AQI is Unhealthy (150-301)

Severe symptoms including intense wheezing, severe shortness of breath, significant chest tightness, and persistent coughing that may disrupt daily activities.

Do's :

  • Avoid going outside and keep windows closed to reduce exposure to pollutants.

  • Take prescribed medications as directed by your healthcare provider.

  • Maintain clean indoor air with air purifiers, especially in bedrooms and living areas.

Don'ts :

  • Smoke or expose yourself to secondhand smoke.

  • Engage in physical exertion outdoors.

Most Polluted Cities 2025

India

Analyze the real-time most air polluted cities in the country.

About New Delhi Air Pollution

New Delhi Monthly AQI Analysis

Explore the AQI changes as a comparison from the past month, as well as how it differs from the same month last year

May 2024 vs May 2025

May 2024
172AQI
May 2025
137AQI
20.35 %
Fall

Compared to May 2024, the AQI in May 2025 changed from Unhealthy to Poor.

Apr. 2025 vs May 2025

Apr. 2025
152AQI
May 2025
137AQI
9.87 %
Fall

AQI levels changed from 'Unhealthy' in Apr. 2025 to 'Poor' in May 2025.


New Delhi's annual 2025 AQI (164) shows an average percentage change of 0.09% (worsened AQI) compared to previous years: 2020 (153), 2021 (162), 2022 (174), 2023 (164), 2024 (169).

New Delhi's AQI Data Analytics Solutions

Air quality data monitoring platforms
Mobile AppMobile App
Smart TV AppSmart TV App
Web DashboardWeb Dashboard
APIAPI
WidgetsWidgets
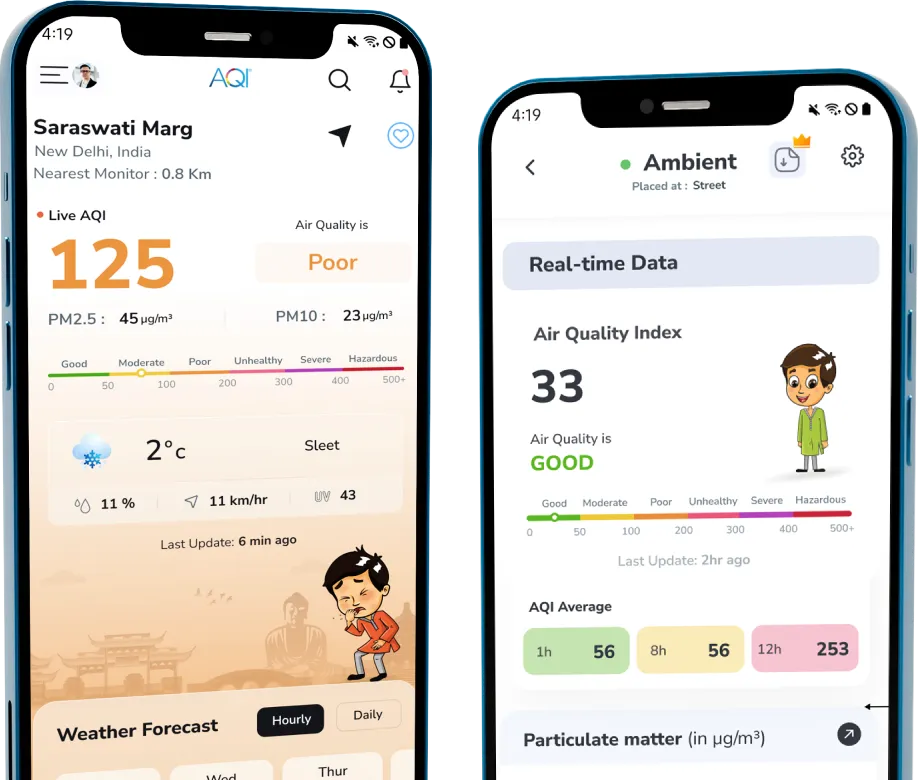
aqi air quality app for New Delhi
Mobile App

Empower Your Decisions with Reliable Data

Your area’s real-time data with detailed parameters.

Your area’s real-time data with detailed parameters.


Personalized health advice as per current AQI.

Personalized health advice as per current AQI.


Analytical data to identify trends and conditions.

Analytical data to identify trends and conditions.


Connect and control your air quality devices.

Connect and control your air quality devices.


Air Quality FAQs

at New Delhi

Frequently Asked Questions About Air Quality

What is the current AQI level in New Delhi?

The current real-time AQI level in New Delhi is 157 (Unhealthy). This was last updated 2025-05-29 06:11:01 AM (Local Time).

When was the best AQI level in New Delhi in the last 24 hours?

The best AQI level was 110 (Poor) at 3:09 PM, May 28, 2025 (Local Time) during the last 24 hours.

When was the worst AQI level in New Delhi in the last 24 hours?

The worst AQI level was 163 (Unhealthy) at 11:09 PM, May 28, 2025 (Local Time) during the last 24 hours.

What is the current trend of AQI levels in New Delhi during last 24 hours?

The AQI levels in New Delhi have been fluctuating throughout the last 24 hours. The levels have increased by highest 163 at 11:09 PM, May 28, 2025 (Local Time), lowest 110 at 3:09 PM, May 28, 2025 (Local Time).

What actions are recommended as per the current AQI level in New Delhi?

Current AQI levels are unhealthy for everyone. It's advised to limit outdoor activities and consider using air purifiers indoors.