Live

United Kingdom Air Quality Index (AQI) | Air Pollution

Real-time PM2.5, PM10 air pollution level in United Kingdom

Last Updated: 8 minutes ago (Local Time)

location image
Live AQI
19
Air Quality is
Good
pm10 :  9 µg/m³
PM2.5 :  3 µg/m³
Good
050
Moderate
100
Poor
150
Unhealthy
200
Severe
300
Hazardous
301+
aqi good level in United Kingdom
Map

United Kingdom

Major Air Pollutants

United Kingdom

AQI Graph

Historical Air Quality Data

United Kingdom

United Kingdom

Download 2024 Annual Data

World Air Quality Report

Globe

United Kingdom's States

Real-time Air Pollution Level

Location
Status
AQI
PM2.5(µg/m³)
PM10(µg/m³)
Temp.(°C)
Humi.(%)
Aberdeen City
Good
15
3
7
10
92
Angus
Good
13
2
7
12
83
Antrim And Newtownabbey
Good
15
3
7
13
93
Ards And North Down
Good
23
4
8
12
94
Belfast
Good
14
2
8
13
94
Bexley
Good
25
5
11
13
74
Birmingham
Good
23
4
8
12
94
Blackpool
Good
17
3
7
12
93
Bournemouth
Good
33
6
11
14
90
Brent
Good
26
4
13
14
78
Bristol
Good
23
4
10
18
87
Bury
Good
21
4
9
12
94
Caerphilly
Good
24
4
10
14
93
Cambridgeshire
Good
28
5
12
13
84
Camden
Good
23
4
10
15
75
Cardiff
Good
22
4
10
15
93
Central Bedfordshire
Good
21
4
10
13
86
Clackmannanshire
Good
14
3
7
12
89
Cornwall
Good
14
3
8
14
94
Coventry
Good
24
4
9
12
94
Croydon
Good
24
4
12
15
85
Cumbria
Good
18
3
7
12
92
Derbyshire
Good
16
3
9
12
94
Derry And Strabane
Good
12
2
7
13
96
Devon
Good
16
3
8
15
93
Dorset
Good
37
7
13
13
91
Dundee City
Good
14
3
7
12
83
Ealing
Good
19
4
12
14
78
East Ayrshire
Good
14
3
8
12
99
East Dunbartonshire
Good
14
2
8
12
99
East Lothian
Good
20
4
8
12
89
East Renfrewshire
Good
13
2
8
12
99
East Sussex
Good
28
5
13
14
81
Edinburgh
Good
14
3
7
12
90
Essex
Good
22
4
8
12
91
Falkirk
Good
18
3
13
12
91
Fife
Good
14
2
7
12
90
Gateshead
Good
20
4
10
11
94
Glasgow
Good
17
3
8
12
99
Greenwich
Good
23
4
12
13
74
Hampshire
Good
18
3
8
14
82
Haringey
Good
38
7
15
14
79
Harrow
Good
24
4
10
14
82
Highland
Good
13
2
8
10
92
Hillingdon
Good
17
3
9
14
78
Inverclyde
Good
16
3
8
12
99
Isle Of Anglesey
Good
18
3
8
14
94
Kent
Good
22
4
9
13
80
Kingston Upon Hull
Good
24
4
9
12
87
Knowsley
Good
21
4
9
12
94
Lambeth
Good
17
3
13
15
74
Lancashire
Good
16
3
7
12
94
Leeds
Good
22
4
8
12
94
Leicester
Good
24
4
8
12
93
Lewisham
Good
25
4
12
14
74
Lisburn And Castlereagh
Good
16
3
7
13
94
London
Good
24
4
12
14
76
Manchester
Good
16
3
9
12
93
Medway
Good
16
3
10
13
78
Merton
Good
25
5
12
15
82
Midlothian
Good
13
2
8
12
89
Monmouthshire
Good
16
3
12
14
94
Neath Port Talbot
Good
28
5
14
14
94
Newham
Good
22
4
12
13
72
Newport
Good
17
3
8
13
92
Newry
Good
17
3
9
14
92
Norfolk
Good
26
5
10
13
91
North Ayrshire
Good
14
3
8
12
99
North Lanarkshire
Good
13
2
8
12
98
Northamptonshire
Good
33
6
10
12
92
Nottingham
Good
20
4
8
12
92
Oxfordshire
Good
22
4
8
14
90
Pembrokeshire
Good
29
5
11
14
94
Perth And Kinross
Good
14
2
7
12
90
Plymouth
Good
24
4
10
15
97
Portsmouth
Good
26
4
12
14
78
Reading
Good
22
4
9
13
81
Redbridge
Good
22
4
10
14
74
Redcar And Cleveland
Good
17
3
8
12
90
Renfrewshire
Good
15
3
8
12
99
Rhondda Cynon Taff
Good
33
6
13
14
94
Richmond Upon Thames
Good
24
4
12
14
78
Salford
Good
22
4
8
12
92
Sheffield
Good
19
4
8
12
94
Solihull
Good
22
4
8
12
93
South Ayrshire
Good
14
3
8
12
94
South Lanarkshire
Good
13
2
8
12
98
Southampton
Good
29
5
11
14
85
Southend On Sea
Good
22
4
9
13
89
Stirling
Good
14
2
7
12
91
Stockport
Good
21
4
8
12
94
Stockton On Tees
Good
24
4
10
12
93
Stoke On Trent
Good
21
4
8
12
94
Sunderland
Good
20
4
8
11
93
Surrey
Good
24
4
12
14
80
Swansea
Good
22
4
8
14
94
Thurrock
Good
18
4
10
12
81
Torfaen
Good
21
4
8
14
92
Tower Hamlets
Good
25
5
13
14
74
Trafford
Good
22
4
9
12
92
Vale Of Glamorgan
Good
17
3
9
15
82
Waltham Forest
Good
26
5
12
14
74
Warrington
Good
16
3
8
13
92
Warwickshire
Good
22
4
9
12
94
West Dunbartonshire
Good
13
2
8
12
100
West Lothian
Good
13
2
7
12
90
West Sussex
Good
23
4
9
14
82
Wigan
Good
17
3
7
12
93
Wirral
Good
17
3
7
12
93
Wrexham
Good
23
4
8
12
94
York
Good
26
4
8
11
95

United Kingdom's Metro Cities

Air Quality Index

Most Polluted Cities 2025

United Kingdom

Analyze the real-time most air polluted cities in the country.

United Kingdom's AQI Data Analytics Solutions

Air quality data monitoring platforms
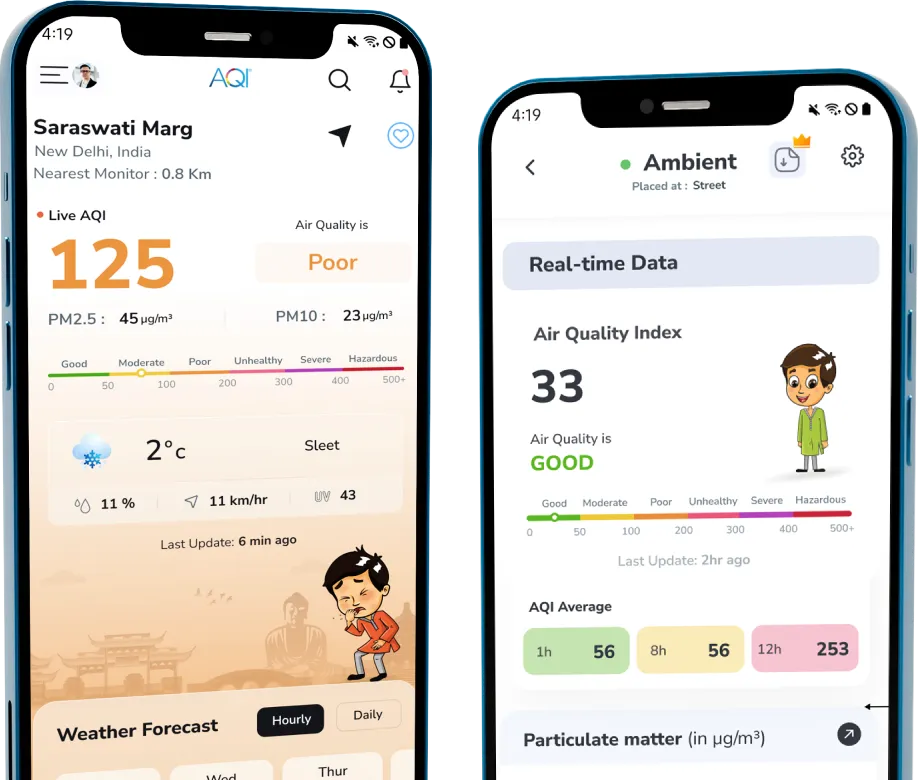
Mobile AppMobile App
Smart TV AppSmart TV App
Web DashboardWeb Dashboard
APIAPI
WidgetsWidgets
aqi air quality app for United Kingdom
Mobile App

Empower Your Decisions with Reliable Data

Your area’s real-time data with detailed parameters.

Your area’s real-time data with detailed parameters.


Personalized health advice as per current AQI.

Personalized health advice as per current AQI.


Analytical data to identify trends and conditions.

Analytical data to identify trends and conditions.


Connect and control your air quality devices.

Connect and control your air quality devices.


Air Quality FAQs

at United Kingdom

Frequently Asked Questions About Air Quality

What is the current AQI level in United Kingdom?

The current real-time AQI level in United Kingdom is 19 (Good) due to recent rainfall by 0.06mm/hr. This was last updated 8 minutes ago (Local Time).

When was the best AQI level in United Kingdom in the last 24 hours?

The best AQI level was 17 (Good) at 3:10 PM, May 28, 2025 (Local Time) during the last 24 hours.

When was the worst AQI level in United Kingdom in the last 24 hours?

The worst AQI level was 20 (Good) at 9:10 AM, May 28, 2025 (Local Time) during the last 24 hours.

What is the current trend of AQI levels in United Kingdom during last 24 hours?

The AQI levels in United Kingdom remained stable over the last 24 hours as around 17.76 .

What actions are recommended as per the current AQI level in United Kingdom?

The air quality is satisfactory, and air pollution poses little or no risk. No special precautions are needed; enjoy outdoor activities freely.